Posted on
January 24, 2024
by
Steve Flynn
The Bank of Canada maintained its overnight rate at 5 per cent this morning. In the statement accompanying the decision, the Bank noted that the Canadian economy has stalled since the middle of 2023 and that growth will likely remain flat until the second quarter of 2024. Slow economic growth has allowed supply to catch up to demand and the Bank now judges that the economy is operating with moderate excess supply. On inflation, the Bank expects inflation to remain close to 3 per cent in the first half of 2024 before gradually falling back to its 2 per cent target in 2025. However, the Bank cautions that while price pressure is falling across a broad number of CPI components, core inflation is not showing a sustained decline. As such, the Bank is still concerned about the risk to the outlook from persistent underlying inflation.
Today's interest rate decision and the tenor of the accompanying statement were not surprising given slightly hotter than expected core inflation in December. However, we expect inflation will resume on its trajectory down to 2 per cent, with some stickiness due to supply side driven shelter costs. Falling inflation, along with weak economic growth and a softening labour market will necessitate rate cuts this year to jumpstart a fledgling economy heading into 2025. We expect the Bank of Canada will lower its overnight rate in June, ultimately lowering to 4 per cent by the end of the year. Financial market expectations for more aggressive rate cuts prompted a steep decline in 5-year bond yields, and therefore 5-year fixed mortgage rates, to start 2024 but yields have since retraced slightly following December's CPI data. We anticipate that 5-year fixed mortgage rates, currently averaging 5.39 per cent, will eventually fall to 5 per cent by the end of the year and will settle near 4.5 per cent by the end of 2025.
Copyright British Columbia Real Estate Association. Reprinted with permission.
Posted on
January 21, 2024
by
Steve Flynn
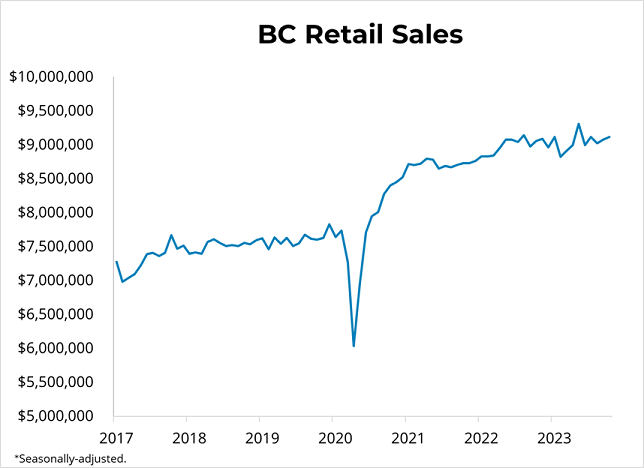
Canadian retail sales fell 0.2 per cent in November to $66.6 billion. Excluding volatile items, sales were down 0.6 per cent month-over-month. In volume terms, retail sales decreased 0.2 per cent in November. Retail e-commerce trade fell by 1.5 per cent to $3.9 billion in November, amounting to 5.8 per cent of total retail sales.
Sales in BC rose 0.7 per cent in November. BC retail sales are up 1.4 per cent from the same time last year. In the CMA of Vancouver, retail sales were up 1.2 per cent from last month and 3.3 per cent from November of 2022.
Copyright British Columbia Real Estate Association. Reprinted with permission.
Posted on
January 18, 2024
by
Steve Flynn
Canadian housing starts rose 18 per cent to 249,255 units in December at a seasonally adjusted annual rate (SAAR). Starts were down 1 per cent from the same month last year. Single-detached housing starts fell 3 per cent from last month to 52,426 units, while multi-family and others rose 25 per cent to 196,830 units (SAAR).
In British Columbia, starts jumped 58 per cent from last month to 62,458 units SAAR in all areas of the province. In areas in the province with 10,000 or more residents, single-detached starts fell 8 per cent to 4,559 units while multi-family starts leaped 71 per cent to 55,329 units. Starts in the province were 8 per cent above the levels from December 2022. Starts rose from last month by 19.5k units in Vancouver, 2.2k in Victoria, and 3.8k in Kelowna while falling by 4.5k in Abbotsford. The 6-month moving average trend in BC fell by 1 per cent to 49,785 SAAR.
For the full year of 2023, starts in areas of Canada with 10,000 or more residents declined 7 per cent to 223,513, driven by a 25 per cent decline in single-family homes. However, starts were up 8 per cent in British Columbia and 28 per cent in Vancouver from 2022.
Copyright British Columbia Real Estate Association. Reprinted with permission.
Posted on
January 14, 2024
by
Steve Flynn
The British Columbia Real Estate Association (BCREA) reports that 73,109 residential unit sales were recorded by the Multiple Listing Service® (MLS®) in 2023, a 9.2 per cent decline from 80,506 units sold in 2022. The annual average MLS® residential price in BC was $971,144, a 2.6 per cent decrease from $996,943 recorded the previous year. Total sales dollar volume was $71 billion, an 11.5 per cent decline from 2022.
“The highest mortgage rates in over 15 years led to the slowest sales in a decade for BC,” said BCREA Chief Economist Brendon Ogmundson. “With mortgage rates falling to start the year and the potential for Bank of Canada rate cuts on the horizon, the outlook for 2024 appears much brighter.”
A total of 3,596 residential unit sales were recorded in Multiple Listing Service® (MLS®) systems in December 2023, an increase of 2.6 per cent from December 2022. The average MLS® residential price in BC was $965,447 a 6.5 per cent increase from $906,356 recorded in December 2022. Total sales dollar volume was $3.5 billion, a 9.3 per cent increase from the same time last year.
Copyright British Columbia Real Estate Association. Reprinted with permission.
Posted on
January 6, 2024
by
Steve Flynn
Canadian employment was nearly unchanged from the prior month in December at 20.313 million. The Canadian unemployment rate also held steady at 5.8 per cent. Average hourly wages rose 5.4 per cent year-over-year to $34.45 in December, while total hours worked were up 1.7 per cent from December of last year.
Employment in BC rose 0.6 per cent to 2.84 million, while employment in Metro Vancouver rose 0.6 per cent to 1.62 million. The unemployment rate rose 0.3 points in BC to 5.6 per cent while rising in Metro Vancouver at 6.2 per cent in December.
Copyright British Columbia Real Estate Association. Reprinted with permission.
Posted on
January 5, 2024
by
Steve Flynn
The MLS® Home Price Index composite benchmark price for all residential properties in Metro Vancouver* is currently $1,168,700. This represents a 1.4% decrease from November 2023 and a 5.0% increase from December 2022.
Specifically:
- The benchmark price for detached homes decreased 0.9% from Nov 2023 and increased 7.7% from Dec 2022.
- The benchmark price for townhouses decreased 1.8% from Nov 2023 and increased 6.4% from Dec 2022.
- The benchmark price for apartment/condos decreased 1.5% from Oct 2023 and increased 5.6% from Dec 2022.
*Areas covered by the Real Estate Board of Greater Vancouver include: Burnaby, Coquitlam, Maple Ridge, New Westminster, North Vancouver, Pitt Meadows, Port Coquitlam, Port Moody, Richmond, South Delta, Squamish, Sunshine Coast, Vancouver, West Vancouver, and Whistler.
Posted on
January 4, 2024
by
Steve Flynn
Metro Vancouver’s* housing market closed out 2023 with balanced market conditions, but the year-end totals mask a story of surprising resilience in the face of the highest borrowing costs seen in over a decade:
The Real Estate Board of Greater Vancouver (REBGV) reports that residential sales in the region totalled 26,249 in 2023, a 10.3 per cent decrease from the 29,261 sales recorded in 2022, and a 41.5 per cent decrease from the 44,884 sales in 2021. Last year’s sales total was 23.4 per cent below the 10-year annual sales average (34,272).
“You could miss it by just looking at the year-end totals, but 2023 was a strong year for the Metro Vancouver housing market considering that mortgage rates were the highest they’ve been in over a decade,” Andrew Lis, REBGV’s director of economics and data analytics said. “In our 2023 forecast, we called for modest price increases throughout the year while most other forecasters were predicting price declines. The fact that we ended the year with five-per-cent-plus gains in home prices across all market segments demonstrates that Metro Vancouver remains an attractive and desirable destination, and elevated borrowing costs alone aren’t enough to dissuade buyers determined to get into this market.”
Properties listed on the Multiple Listing Service® (MLS®) in Metro Vancouver totalled 50,893 in 2023. This represents a 7.5 per cent decrease compared to the 55,047 properties listed in 2022. This was 20.2 per cent below the 63,761 properties listed in 2021.
The total number of properties listed last year was 10.5 per cent below the region’s 10-year total annual average of (56,868). Currently, the total number of homes listed for sale on the MLS® system in Metro Vancouver is 8,802, a 13 per cent increase compared to December 2022 (7,791). This is 0.3 per cent above the 10-year seasonal average (8,772).
The MLS® Home Price Index composite benchmark price for all residential properties in Metro Vancouver is currently $1,168,700. This represents a five per cent increase over December 2022 and a 1.4 per cent decrease compared to November 2023.
“Ultimately, the story of 2023 is one of too few homes available relative to the pool of willing and qualified buyers,” Lis said. “Sellers were reluctant to list their properties early in the year, which led to fewer sales than usual coming out of the gate. But this also led to near record-low inventory levels in the spring, which put upward pressure on prices as buyers competed for the scarce few homes available.”
“Looking back on the year, it’s hard not to wonder how we’d be closing out 2023 if mortgage rates had been a few per cent lower than they were. And it looks like we might get some insight into that question in 2024, as bond markets and professional forecasters are projecting lower borrowing costs are likely to come, with modest rate cuts expected in the first half of the New Year.”
* Areas covered by the Real Estate Board of Greater Vancouver include: Burnaby, Coquitlam, Maple Ridge, New Westminster, North Vancouver, Pitt Meadows, Port Coquitlam, Port Moody, Richmond, South Delta, Squamish, Sunshine Coast, Vancouver, West Vancouver, and Whistler.
Posted on
January 1, 2024
by
Steve Flynn
Metro Vancouver's* housing market shows resilience in 2023, ending the year in balanced territory:
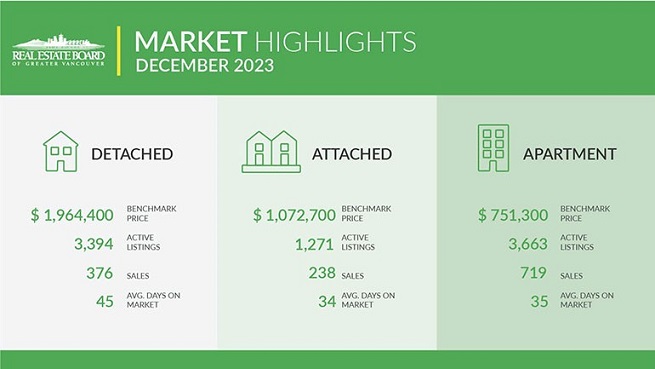
Residential sales in the region totalled 1,345 in December 2023, a 3.2 per cent increase from the 1,303 sales recorded in December 2022. This was 36.4 per cent below the 10-year seasonal average (2,114).
There were 1,327 detached, attached and apartment properties newly listed for sale on the Multiple Listing Service® (MLS®) in Metro Vancouver in December 2023. This represents a 9.9 per cent increase compared to the 1,208 properties listed in December 2022. This was 22.7 per cent below the 10-year seasonal average (1,716).
Across all detached, attached and apartment property types, the sales-to-active listings ratio for December 2023 is 16 per cent. By property type, the ratio is 11.1 per cent for detached homes, 18.7 per cent for attached, and 19.6 per cent for apartments.
Analysis of the historical data suggests downward pressure on home prices occurs when the ratio dips below 12 per cent for a sustained period, while home prices often experience upward pressure when it surpasses 20 per cent over several months.
Sales of detached homes in December 2023 reached 376, a 1.3 per cent increase from the 371 detached sales recorded in December 2022. The benchmark price for a detached home is $1,964,400. This represents a 7.7 per cent increase from December 2022 and a 0.9 per cent decrease compared to November 2023.
Sales of apartment homes reached 719 in December 2023, a 2.4 per cent increase compared to the 702 sales in December 2022. The benchmark price of an apartment home is $751,300. This represents a 5.6 per cent increase from December 2022 and a 1.5 per cent decrease compared to November 2023.
Attached home sales in December 2023 totalled 238, a 7.2 per cent increase compared to the 222 sales in December 2022. The benchmark price of a townhouse is $1,072,700. This represents a 6.4 per cent increase from December 2022 and a 1.8 per cent decrease compared to November 2023.
* Areas covered by the Real Estate Board of Greater Vancouver include: Burnaby, Coquitlam, Maple Ridge, New Westminster, North Vancouver, Pitt Meadows, Port Coquitlam, Port Moody, Richmond, South Delta, Squamish, Sunshine Coast, Vancouver, West Vancouver, and Whistler.
Posted on
December 24, 2023
by
Steve Flynn
Canadian real GDP was nearly unchanged for the third consecutive month in October. Manufacturing contracted 0.6 per cent in October, led by declines in durable goods. Construction activity fell by 0.1 per cent, but residential construction continued to grow strongly, rising by 1.2 per cent from the prior month. Offices of real estate agents and brokers fell for the fourth consecutive month, dropping 6.8 per cent as home resales continues to soften amid elevated borrowing costs. Preliminary estimates suggest that output in the Canadian economy rose 0.1 per cent in November.
In October, Canadian inflation-adjusted GDP extended its streak of almost exactly zero growth or contraction in economic activity. Canadian real GDP is little changed from where it was in March, despite a large increase in the national population due to immigration. The economy continues to avoid a technical recession, but with per capita real GDP declining, Canadian GDP growth remains very soft. In addition, labour markets are gradually softening across Canada, and the inflation rate has shown signs of cooling, with 3-month moving averages of core inflation well below 3 per cent. Given this data, markets now broadly anticipate that the Bank of Canada will not raise its benchmark rate further. The question is, instead, how quickly the Bank will cut rates in 2024, with the balance of probabilities on cuts beginning in the spring and accumulating by the summer and towards the end of the year. The next rate announcement is on next Wednesday, January 24th.
Copyright British Columbia Real Estate Association. Reprinted with permission.
Posted on
December 22, 2023
by
Steve Flynn
Canadian retail sales increased 0.7 per cent in October to $66.9 billion. Excluding volatile items, sales were up 1.2 per cent month-over-month. In volume terms, retail sales increased 1.4 per cent in October. Retail e-commerce trade rose by 1.8 per cent to $3.9 billion in October, amounting to 5.9 per cent of total retail sales.
Sales in BC rose 0.5 per cent in October. BC retail sales are up 0.7 per cent from the same time last year. In the CMA of Vancouver, retail sales were up 0.7 per cent from last month and 2.3 per cent from October of 2022.
Copyright British Columbia Real Estate Association. Reprinted with permission.
Posted on
December 21, 2023
by
Steve Flynn
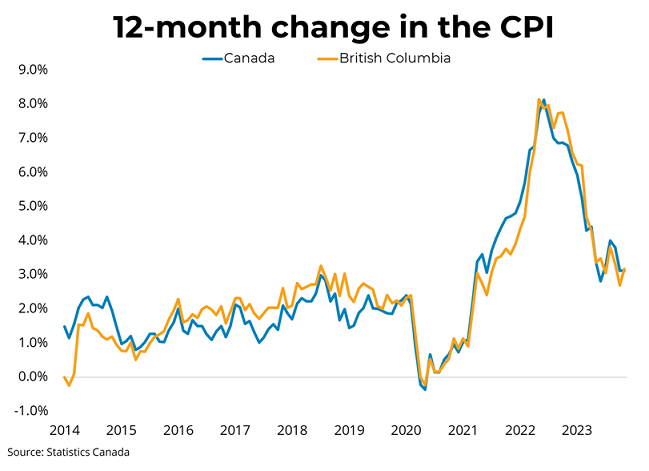
Canadian prices, as measured by the Consumer Price Index (CPI), rose 3.1 per cent on a year-over-year basis in November, unchanged from the rate in October. Excluding energy costs, CPI rose 3.8 per cent year-over-year in November. Shelter costs continue to be a major driver of inflation, with mortgage interest costs up 29.8 per cent and rent up 7.4 per cent. Grocery price inflation continued to moderate, but nevertheless increased 4.7 per cent year-over-year last month. Month over month, seasonally adjusted CPI rose 0.25 per cent. In BC, consumer prices rose 3.2 per cent year-over-year. The Bank of Canada's preferred measures of core inflation, which strip out volatile components, remained around 3.5 per cent year-over-year in November.
After considerable progress in taming inflation, the rate of change in the CPI has stubbornly remained close to the 3-4 per cent range since the late spring. Alongside softening labour markets and weak GDP growth, inflation in this territory has been sufficient to keep the Bank of Canada from raising rates since the summer. Although softer gasoline prices have done some of the work to pull down the inflation rate, large increases in mortgage interest costs, which are a direct consequence of Bank tightening, have pulled inflation upwards. Indeed, inflation excluding mortgage interest costs was unchanged from last month at just 2.2 per cent. Taken together, markets expect that the Bank of Canada is unlikely to raise rates further. Rather, markets expect the Bank to cut rates substantially by the summer of 2024, but this will of course depend on the rate of economic growth and price appreciation in the first half of the year.
Copyright British Columbia Real Estate Association. Reprinted with permission.
Posted on
December 17, 2023
by
Steve Flynn
Canadian housing starts fell sharply by 22 per cent to 212,624 units in November at a seasonally adjusted annual rate (SAAR). Starts were down 19 per cent from the same month last year. Single-detached housing starts fell 6 per cent from last month to 56,268 units, while multi-family and others fell 26 per cent to 156,356 units (SAAR).
In British Columbia, starts dropped 35 per cent from last month to 39,051 units SAAR in all areas of the province. In areas in the province with 10,000 or more residents, single-detached starts fell 7 per cent to 5,181 units while multi-family starts dived by 40 per cent to 31,288 units. Starts in the province were 19 per cent below the levels from November 2022. Starts fell from last month by 13.6k units in Vancouver, 3.2k in Victoria, and 4.4k in Kelowna while rising by 2.1k in Abbotsford. The 6-month moving average trend in BC fell by 0.6 per cent to 50,543 SAAR.
Copyright British Columbia Real Estate Association. Reprinted with permission.
Posted on
December 12, 2023
by
Steve Flynn
The MLS® Home Price Index composite benchmark price for all residential properties in Metro Vancouver* is currently $1,185,100. This represents a 1.0% decrease from October 2023 and a 4.9% increase from November 2022.
Specifically:
- The benchmark price for detached homes decreased 0.9% from Oct 2023 and increased 6.8% from Nov 2022.
- The benchmark price for townhouses decreased 0.7% from Oct 2023 and increased 6.9% from Nov 2022.
- The benchmark price for apartment/condos decreased 1.0% from Oct 2023 and increased 6.2% from Nov 2022.
*Areas covered by the Real Estate Board of Greater Vancouver include: Burnaby, Coquitlam, Maple Ridge, New Westminster, North Vancouver, Pitt Meadows, Port Coquitlam, Port Moody, Richmond, South Delta, Squamish, Sunshine Coast, Vancouver, West Vancouver, and Whistler.
Posted on
December 7, 2023
by
Steve Flynn
As expected, the Bank of Canada held its overnight rate at 5 per cent this morning. In the statement accompanying the decision, the Bank noted that economic growth stalled through the middle quarters of 2023 and that slowdown in growth is expected to extend into the fourth quarter. As a result, inflationary pressure is easing, though the Bank stated that it is still concerned about risks to the outlook for inflation and wants to see a sustained easing of core inflation in future months.
Given the evidence of a slowing economy and some long-awaited downward momentum in core inflation, it appears likely that the Bank of Canada’s rate-tightening cycle is at an end. If so, the conversation around Bank of Canada meetings in 2024 will shift toward when the Bank might lower rates and how fast. Given that the Bank’s estimate for its neutral rate is between 2 and 3 per cent, we can expect between 200 and 300 basis points of rate cuts once it is clear that inflation is returning to its 2 per cent target. After hitting a 15-year high this fall, Canadian bond yields have been tumbling to finish the year as financial markets process meaningful progress on reducing inflation and the projected end of central bank rate hikes. The five-year Government of Canada bond yield has trended near 3.5 per cent over the last week and if that trend sustains, we will see a meaningful decline in fixed mortgage rates to start 2024. Our forecast is for the average 5-year fixed mortgage rate to fall to about 5 per cent by the end of 2024, while variable rates will begin falling as the Bank of Canada lowers its overnight rate starting in the first or second quarter of next year.
Copyright British Columbia Real Estate Association. Reprinted with permission.
Posted on
December 6, 2023
by
Steve Flynn
With one month left in 2023, a steady increase in housing inventory is offering home buyers across Metro Vancouver* among the largest selection to choose from since 2021.
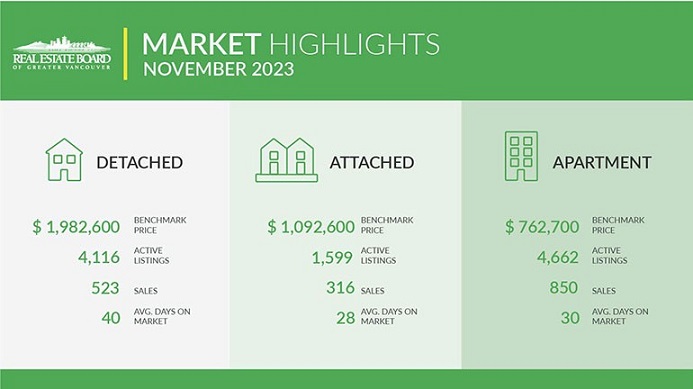
The Real Estate Board of Greater Vancouver (REBGV) reports that residential sales2 in the region totalled 1,702 in November 2023, a 4.7 per cent increase from the 1,625 sales recorded in November 2022. This was 33 per cent below the 10-year seasonal average (2,538).
“We’ve been watching the number of active listings in our market increase over the past few months, which is giving buyers more to choose from than they’ve been used to seeing over the past few years,” Andrew Lis, REBGV’s director of economics and data analytics said. “When paired with the seasonal slowdown in sales we typically see this time of year, this increase in supply is creating balanced conditions across Metro Vancouver’s housing market.”
There were 3,369 detached, attached and apartment properties newly listed for sale on the Multiple Listing Service® (MLS®) in Metro Vancouver in November 2023. This represents a 9.8 per cent increase compared to the 3,069 properties listed in November 2022. This was 2.8 per cent below the 10-year seasonal average (3,464).
The total number of properties currently listed for sale on the MLS® system in Metro Vancouver is 10,931, a 13.5 per cent increase compared to November 2022 (9,633). This is 3.7 per cent above the 10-year seasonal average (10,543).
Across all detached, attached and apartment property types, the sales-to-active listings ratio for November 2023 is 16.3 per cent. By property type, the ratio is 12.7 per cent for detached homes, 19.8 per cent for attached, and 18.2 per cent for apartments.
Analysis of the historical data suggests downward pressure on home prices occurs when the ratio dips below 12 per cent for a sustained period, while home prices often experience upward pressure when it surpasses 20 per cent over several months.
“Balanced market conditions typically come with flatter price trends, and that’s what we’ve seen in the market since the summer months. These trends follow a period where prices rose over seven per cent earlier in the year,” Lis said. “You probably won’t find Cyber Monday discounts, but prices have edged lower by a few per cent since the summer. And with most economists expecting mortgage rates to fall modestly in 2024, market conditions for buyers are arguably the most favorable we’ve seen in some time in our market.”
The MLS® Home Price Index composite benchmark price for all residential properties in Metro Vancouver is currently $1,185,100. This represents a 4.9 per cent increase over November 2022 and a one per cent decrease compared to October 2023.
Sales of detached homes in November 2023 reached 523, a seven per cent increase from the 489 detached sales recorded in November 2022. The benchmark price for a detached home is $1,982,600. This represents a 6.8 per cent increase from November 2022 and a 0.9 per cent decrease compared to October 2023.
Sales of apartment homes reached 850 in November 2023, a 0.4 per cent increase compared to the 847 sales in November 2022. The benchmark price of an apartment home is $762,700. This represents a 6.2 per cent increase from November 2022 and a one per cent decrease compared to October 2023.
Attached home sales in November 2023 totalled 316, a 12.5 per cent increase compared to the 281 sales in November 2022. The benchmark price of a townhouse3 is $1,092,600. This represents a 6.9 per cent increase from November 2022 and a 0.7 per cent decrease compared to October 2023.
* Areas covered by the Real Estate Board of Greater Vancouver include: Burnaby, Coquitlam, Maple Ridge, New Westminster, North Vancouver, Pitt Meadows, Port Coquitlam, Port Moody, Richmond, South Delta, Squamish, Sunshine Coast, Vancouver, West Vancouver, and Whistler.
Posted on
November 30, 2023
by
Steve Flynn
Canadian employment ticked up by 24,900 (0.1 per cent) in November. The Canadian unemployment rate also rose to 5.8 per cent, following an increase to 5.7 per cent last month. Average hourly wages rose 4.8 per cent year-over-year to $34.28 in November, while total hours worked were up 1.3 per cent from November of last year.
Employment in BC rose 0.3 per cent to 2.82 million, while employment in Metro Vancouver fell 0.1 per cent to 1.61 million. The unemployment rate fell 0.1 points in BC to 5.3 per cent while remaining unchanged in Metro Vancouver at 5.8 per cent.
Copyright British Columbia Real Estate Association. Reprinted with permission.
Posted on
November 30, 2023
by
Steve Flynn
Canadian real GDP rose 0.1 per cent from the prior month in September, following contractions in the prior three months. Manufacturing jumped 0.9 per cent in September as inventory formation pushed economic activity upwards. Construction activity rose by 1 per cent, with residential building up 3.9 per cent, the largest gain since April 2021. Offices of real estate agents and brokers fell for the third consecutive month, dropping 4.1 per cent as sales weakened into the fall. Preliminary estimates suggest that output in the Canadian economy rose 0.2 per cent in October.
GDP declined 0.3 per cent in the third quarter, erasing a 0.3 per cent gain in the second quarter. The slowdown was driven in part by weaker exports, which declined 1.3 per cent from the prior quarter, led by weaker petroleum exports. Housing investment rose 2 per cent from the prior quarter but an increase in new construction (+6.4 per cent) was offset by a contraction in ownership transfer costs representing resale activity (-4.3 per cent). Employee compensation rose 1.3 per cent and household disposable income rose 1 per cent, driving the household saving rate to 5.1 per cent in the third quarter.
Canadian GDP bucked expectations and contracted in the third quarter, declining by 1.1 per cent on an annualized basis. At the same time, Statistics Canada revised its second-quarter GDP figure considerably upward, meaning that the economy has again avoided entering a technical recession. With October's preliminary figure again positive, the Canadian economy appears weak but is so far not shrinking substantially in aggregate terms. However, with very soft GDP figures occurring amid a rising unemployment rate and some progress on inflation, markets continue to expect that the Bank of Canada is likely at the end of its tightening cycle. The next rate announcement is on next Wednesday, December 6th.
Copyright British Columbia Real Estate Association. Reprinted with permission.
Posted on
November 23, 2023
by
Steve Flynn
Canadian prices, as measured by the Consumer Price Index (CPI), rose 3.1 per cent on a year-over-year basis in October, down from 3.8 per cent in September. Excluding gasoline, CPI rose 3.6 per cent year-over-year in October. Shelter costs continue to be the main driver of inflation, with mortgage interest costs up 30.5 per cent and rent up 8.2 per cent. Grocery price inflation continued to moderate, albeit slowly and still elevated at 5.4 per cent year-over-year. Month over month, seasonally adjusted CPI fell 0.1 per cent, largely as a result of falling gasoline prices. In BC, consumer prices rose 2.7 per cent year-over-year. The Bank of Canada's preferred measures of core inflation showed significant downward momentum for the first time in months, falling to around 3.5 per cent year-over-year after trending near 4 per cent since the spring.
While the main contributor to lower inflation this month was falling gas prices, there were other strong signs of progress on inflation that should please the Bank of Canada. The three-month trend in core inflation measures fell to between 2.7 and 3.1 per cent and inflation excluding mortgage interest costs fell to just 2.2 per cent. Those trends, along with slowing GDP growth and early signs of a weakening labour market, should keep the Bank of Canada sidelined in December and looking to lower rates in 2024.
Copyright British Columbia Real Estate Association. Reprinted with permission.
Posted on
November 16, 2023
by
Steve Flynn
Canadian housing starts rose 1 per cent to 274,681 units in October at a seasonally adjusted annual rate (SAAR). Starts were up 4 per cent from the same month last year. Single-detached housing starts rose 5 per cent from last month to 59,911 units, while multi-family and others rose 1 per cent to 214,768 units (SAAR).
In British Columbia, starts jumped 50 per cent from last month to 60,174 units SAAR in all areas of the province. In areas in the province with 10,000 or more residents, single-detached starts were unchanged from last month at 5,588 units while multi-family starts surged 65 per cent to 51,813 units. Starts in the province were 33 per cent above the levels from October 2022. Starts increased from last month by 9k units in Vancouver, 6.2k in Victoria, 2.9k in Kelowna, and 2.2k in Abbotsford. The 6-month moving average trend in BC fell by 0.3 per cent to 50,887 SAAR.
Copyright British Columbia Real Estate Association. Reprinted with permission.
Posted on
November 15, 2023
by
Steve Flynn
The British Columbia Real Estate Association (BCREA) reports that a total of 5,373 residential unit sales were recorded in Multiple Listing Service® (MLS®) systems in October 2023, an increase of 1.8 per cent from October 2022. The average MLS® residential price in BC was $968,786 up 4.1 per cent compared to October 2022. The total sales dollar volume was $5.2 billion, representing a 6 per cent increase from the same time last year.
“Home sales have slowed as expected given high borrowing costs and a punishing stress test,” said BCREA Chief Economist Brendon Ogmundson. “However, the inventory of homes for sale remains quite low, despite a modest uptick in new listings. Consequently, markets have found balance, though at a very low level of activity.”
On a seasonally adjusted basis, active listings in the province have increased for the fifth consecutive month, but still remain low by historical standards and fall short of what is typically required for a sustainable market balance in the long term.
Year-to-date BC residential sales dollar volume was down 13.6 per cent to $63.1 billion, compared with the same period in 2022. Residential unit sales were down 105 per cent to 64,936 units, while the average MLS® residential price was down 3.4 per cent to $971,802.
Copyright British Columbia Real Estate Association. Reprinted with permission.
Categories:
Abbotsford West, Abbotsford Real Estate
|
Bolivar Heights, North Surrey Real Estate
|
Brentwood Park, Burnaby North Real Estate
|
Brighouse, Richmond Real Estate
|
Burnaby
|
Burnaby Real Estate
|
Burnaby South Real Estate
|
Cape Horn, Coquitlam Real Estate
|
Cariboo, Burnaby North Real Estate
|
Central BN, Burnaby North Real Estate
|
Central Coquitlam, Coquitlam
|
Central Coquitlam, Coquitlam Real Estate
|
Champlain Heights, Vancouver East
|
Champlain Heights, Vancouver East Real Estate
|
Cloverdale BC, Cloverdale Real Estate
|
Cloverdale BC, Surrey Real Estate
|
Cloverdale Real Estate
|
Coal Harbour, Vancouver West Real Estate
|
Coaquitlam
|
College Park PM, Port Moody Real Estate
|
Collingwood VE, Vancouver East Real Estate
|
Coquitlam
|
Coquitlam West, Coquitlam Real Estate
|
Downtown NW, New Westminster Real Estate
|
Downtown VW, Vancouver West
|
Downtown VW, Vancouver West Real Estate
|
Eagleridge, Coquitlam Real Estate
|
False Creek North, Vancouver West
|
Fraserview NW, New Westminster
|
Fraserview NW, New Westminster Real Estate
|
Fraserview VE, Vancouver East Real Estate
|
GlenBrooke North, New Westminster Real Estate
|
Grandview Surrey, Surrey Real Estate
|
Harrison Hot Springs Real Estate
|
Hastings, Vancouver East Real Estate
|
Highgate, Burnaby South Real Estate
|
Hockaday, Coquitlam Real Estate
|
January 2014 Sales in Greater Vancouver
|
Metrotown, Burnaby South Real Estate
|
New Horizons, Coquitlam Real Estate
|
New Westminster Real Estate
|
Port Moody
|
Port Moody Real Estate
|
Quay, New Westminster Real Estate
|
Queensborough, New Westminster Real Estate
|
Richmond Real Estate
|
Riverdale RI, Richmond Real Estate
|
Riverwood, Port Coquitlam Real Estate
|
Sapperton, New Westminster Real Estate
|
Simon Fraser Univer., Burnaby North Real Estate
|
Surrey
|
The Heights NW, New Westminster
|
The Heights NW, New Westminster Real Estate
|
Tsawwassen Central, Tsawwassen Real Estate
|
Uptown NW, New Westminster Real Estate
|
Uptown, New Westminster Real Estate
|
Vancouver
|
Vancouver East Real Estate
|
Videocast of January 2014 sales
|
Walnut Grove, Langley Real Estate
|
West Central, Maple Ridge Real Estate
|
West End VW, Vancouver West Real Estate
|
Whalley, North Surrey Real Estate
|
Whalley, Surrey Real Estate
|
Willoughby Heights, Langley Real Estate
|
 Subscribe with RSS Reader