Posted on
July 31, 2018
by
Steve Flynn
Canadian real GDP rose 0.5 per cent in May, an acceleration from just 0.1 per cent growth in the month of April. Growth was distributed across a breadth of sectors, with 19 of 20 industrial sectors reporting increased output. The mining and oil and gas sector led the way, posting 0.6 per cent monthly growth in May. Office of real estate agents and brokers fell for the fourth time in five months, in part due to declining home sales in BC resulting from the ongoing impact of the mortgage stress test. With today's release, we are tracking second quarter real GDP growth in Canada at close to 3 per cent.
Very strong second quarter economic growth and a firming of inflation near its 2 per cent target continues to signal higher interest rates on the horizon. We expect the Bank of Canada will raise its overnight rate at least one more time this year with mortgage rates rising in tandem.
Copyright British Columbia Real Estate Association. Reprinted with permission.
Posted on
July 29, 2018
by
Steve Flynn
July’s residential housing sales in Metro Vancouver* reached their lowest levels for that month since the year 2000.
The Real Estate Board of Greater Vancouver (REBGV) reports that residential property sales in the region totalled 2,070 in July 2018, a 30.1 per cent decrease from the 2,960 sales recorded in July 2017, and a decrease of 14.6 per cent compared to June 2018 when 2,425 homes sold.
Last month’s sales were 29.3 per cent below the 10-year July sales average. “With fewer buyers active in today’s market, we’re seeing less upward pressure on home prices across the region,” Phil Moore, REBGV president said. “This is most pronounced in the detached home market, but demand in the townhome and apartment markets is also relenting from the more frenetic pace experienced over the last few years.”
There were 4,770 detached, attached and apartment properties newly listed for sale on the Multiple Listing Service® (MLS®) in Metro Vancouver in July 2018. This represents a 9.2 per cent decrease compared to the 5,256 homes listed in July 2017 and a 9.6 per cent decrease compared to June 2018 when 5,279 homes were listed.
The total number of properties currently listed for sale on the MLS® system in Metro Vancouver is 12,137, a 32 per cent increase compared to July 2017 (9,194) and a 1.6 per cent increase compared to June 2018 (11,947). “Summer is traditionally a quieter time of year in real estate. This is particularly true this year,” Moore said. “With increased mortgage rates and stricter lending requirements, buyers and sellers are opting to take a wait-and-see approach for the time being.”
For all property types, the sales-to-active listings ratio for July 2018 is 17.1 per cent. By property type, the ratio is 9.9 per cent for detached homes, 20.2 per cent for townhomes, and 27.3 per cent for condominiums. Generally, analysts say that downward pressure on home prices occurs when the ratio dips below the 12 per cent mark for a sustained period, while home prices often experience upward pressure when it surpasses 20 per cent over several months.
The MLS® Home Price Index composite benchmark price for all residential properties in Metro Vancouver is currently $1,087,500. This represents a 6.7 per cent increase over July 2017 and a 0.6 per cent decrease compared to June 2018.
Sales of detached properties in July 2018 reached 637, a decrease of 32.9 per cent from the 949 detached sales recorded in July 2017. The benchmark price for detached properties is $1,588,400. This represents a 1.5 per cent decrease from July 2017 and a 0.6 per cent decrease compared to June 2018.
Sales of apartment properties reached 1,079 in July 2018, a decrease of 26.5 per cent compared to the 1,468 sales in July 2017. The benchmark price of an apartment property is $700,500. This represents a 13.6 per cent increase from July 2017 and a 0.5 per cent decrease compared to June 2018.
Attached property sales in July 2018 totalled 354, a decrease of 34.8 per cent compared to the 543 sales in July 2017. The benchmark price of an attached unit is $856,000. This represents a 12.1 per cent increase from July 2017 and a 0.4 per cent decrease compared to June 2018.
* Areas covered by the Real Estate Board of Greater Vancouver include: Whistler, Sunshine Coast, Squamish, West Vancouver, North Vancouver, Vancouver, Burnaby, New Westminster, Richmond, Port Moody, Port Coquitlam, Coquitlam, Pitt Meadows, Maple Ridge, and South Delta.
Copyright British Columbia Real Estate Association. Reprinted with permission.
Posted on
July 28, 2018
by
Steve Flynn
US real GDP growth registered 4.1 per cent in the second quarter of 2018, boosted by 4 per cent growth in consumer spending and over 7 per cent growth in non-residential business investment. However, strong growth is not expected to last beyond 2018. Net exports were driven temporarily higher by a surge in soybean shipments ahead of expected retaliatory tariffs while consumption and investment were jolted higher by tax cuts. Meanwhile, government spending added significantly to overall growth due to massive new funding under the 2018 Bipartisan Budget Act. Once those temporary measures fade, growth will decelerate.
Under normal circumstances, strong economic growth in the United States is good news for the BC economy, which ship half of its goods exports to the US. However, under the current administration, the benefits are lessened by tariffs and the continued threat of further anti-free trade actions.
Copyright British Columbia Real Estate Association. Reprinted with permission.
Posted on
July 27, 2018
by
Steve Flynn
I have sold a property at 101 9300 University CRES in Burnaby. Beautiful 2 bedroom & 2 bath garden home at One University Crescent in SFU, an award winning concrete residence developed by Millennium. Spacious and open floor plan features separated bedrooms and large kitchen opening onto 207 sqft of private, relaxing & quiet patio only available to this ground corner unit. The king size master bedroom is complete with spa inspired en-suite including soaker tub & separate shower stall. Large and over height ceilings allow for plenty of natural light to flow through this lofts suite with lush outlooks through every window. Living is comfortable in this exclusive, serene complex with gym, lounge, billiard room, caretaker and membership to select SFU amenities. Close to shops, transit, school and hiking trails.
Posted on
July 18, 2018
by
Steve Flynn
Canadian manufacturing sales increased 1.4 per cent on a monthly basis in May, pushed higher by gains in the chemical, machinery and wood product industries. Sales were higher in 14 of 21 manufacturing sub-sectors, representing almost two-thirds of manufacturing sales. On a year-over-year basis, Canadian manufacturing sales were up 3.7 per cent over May 2017.
In BC, manufacturing sales were up 3.2 per cent in May on a monthly basis and were 9.7 per cent higher year-over-year. The province's forestry sector led the way as sales of manufactured wood products rose 9.2 per cent from April. The BC manufacturing sector continues to be a bright spot in the economy, with sales up 8.5 per cent year-to-date.
Copyright British Columbia Real Estate Association. Reprinted with permission.
Posted on
July 18, 2018
by
Steve Flynn
Please visit our Open House at 307 668 COLUMBIA ST in New Westminster. Open House on Sunday, July 22, 2018 2:00PM - 4:00PM VERY COOL 662 sq. ft, 1 bed + den/1 bath condo in exciting downtown New West. One of the few lofts in the historic Trapp & Holbrook building. Bright, open space w/10'8" ceilings, big windows & beautiful, original brick feature wall. Very efficient & sleek linear kitchen, good-sized den, laminate flooring and full-sized washer/dryer. In excellent condition, move right in! Amenities incl. party room, gym, common rooftop deck w/patio space, bbq & gardens. Walk to everything with a 95 Walk Score. RARE: this unit comes with 2 PARKING stalls (1 is ELECTRIC-charging!) and good-sized locker. 2 pets allowed and rentals allowed (no AirBnB). Ultimate dt NW lifestyle at your doorstep! OPEN HOUSE: Sun. June 22, 2-4 pm.
Posted on
July 17, 2018
by
Steve Flynn
I have listed a new property at 307 668 COLUMBIA ST in New Westminster. VERY COOL 662 sq. ft, 1 bed + den/1 bath condo in exciting downtown New West. One of the few lofts in the historic Trapp & Holbrook building. Bright w/10'8" ceilings, big windows & beautiful re-claimed brick feature wall. Very efficient space w/sleek linear kitchen, good-sized den, laminate flooring and full-sized washer/dryer. In excellent condition, move right in. Amenities incl. party room, gym, common rooftop deck w/patio space, bbq & gardens. Walk to everything with a 95 Walk Score. RARE: this unit comes with 2 PARKING stalls (1 is ELECTRIC charging!) and good-sized locker. 2 pets allowed and rentals allowed (no AirBnB). Ultimate dt NW lifestyle at your doorstep!
Posted on
July 11, 2018
by
Steve Flynn
Vancouver, BC - July 13, 2018.
The British Columbia Real Estate Association (BCREA) reports that a total of 7,884 residential unit sales were recorded by the Multiple Listing Service® (MLS®) across the province in June, a 32.5 per cent decrease from the same month last year. The average MLS® residential price in BC was $716,326, down 1.3 per cent from June 2017. Total sales dollar volume was $5.6 billion, a 33 per cent decline from June 2017.
The impact of the B20 stress test is still being felt across the province, said Brendon Ogmundson, BCREA Deputy Chief Economist. Lower demand as the result of higher mortgage rates and stringent mortgage qualification rules are bringing most markets around the province back into balanced conditions.
Although the supply of active listings in the province is on the rise, inventory remains low by historical standards and markets like Vancouver Island and the Okanagan remain undersupplied.
Year-to-date, BC residential sales dollar volume was down 18 per cent to $32 billion, compared with the same period in 2017. Residential unit sales decreased 20 per cent to 43,863 units, while the average MLS® residential price was up 2.4 per cent to $730,492.
Copyright British Columbia Real Estate Association. Reprinted with permission.
Posted on
July 11, 2018
by
Steve Flynn
The Bank of Canada opted to raise its target for the overnight rate 25 basis points to 1.5 per cent this morning. In the statement accompanying the decision, the Bank cited that the economy is operating close to capacity and as a result inflation is expected to edge higher over their two year forecast horizon. The Bank noted that incoming data suggests housing markets are starting to stabilize after the implementation of the B20 stress test.
With inflation rising to the Bank's two per cent target and the Canadian economy operating at or near capacity, the Bank of Canada is unlikely to be finished tightening. At its current level, the overnight rate is about 150 basis points below the 3 per cent rate the Bank would ultimately prefer it to be. However, the Bank may take a brief pause to assess the impact of its past tightening as well as the ongoing effects of the B20 stress test on housing markets. It may also be dissuaded from further tightening should there be a further escalation in trade tariffs from the United States. Overall, we expect at least one more round of rate increases from the Bank of Canada in 2018.
Copyright British Columbia Real Estate Association. Reprinted with permission.
Posted on
July 10, 2018
by
Steve Flynn
Canadian housing starts rose 28 per cent on a monthly basis in June to 248,000 units at a seasonally adjusted annual rate (SAAR). The six-month trend in Canadian housing starts was steady at about 222,000 units SAAR.
In BC, total housing starts declined 16 per cent on a monthly basis to 34,300 units SAAR and were down 10 per cent year-over-year. On a monthly basis, starts of multiple units were down 21 per cent to an annual rate of 24,563 units. Multiple unit and single detached starts were both down10 per cent compared to June of last year.
Looking at census metropolitan areas (CMA) in BC:
- Total starts in the Vancouver CMA were down 28 per cent year-over-year due to a 34 per cent decline in multiple unit starts and were down 36 per cent from May 2018. In the first six months of the year, housing starts in the Vancouver CMA were essentially flat compared to the first six months of 2017.
- In the Victoria CMA, housing starts nearly doubled year-over-year and were up 85 per cent on a monthly basis to a seasonally adjusted annual rate of nearly 6,000 units. New home construction is up 45 per cent year-over-year in the first six months of the year. Much of that new construction is the result of a doubling of rental starts compared to last year.
- In the Kelowna CMA, new home construction increased 43 per cent year-over-year as a result of continued growth in multiple unit starts. However, on a monthly basis, total starts were down 6 per cent from May to a rate of 3,590 units SAAR.
- Housing starts in the Abbotsford-Mission CMA fell 5 per cent from May to 515 units SAAR due to a dip in multiple unit starts. Year-over-year, total housing starts fell 82 per cent as only 47 total units including only 16 multiple units were started in June.
Copyright British Columbia Real Estate Association. Reprinted with permission.
Posted on
July 7, 2018
by
Steve Flynn
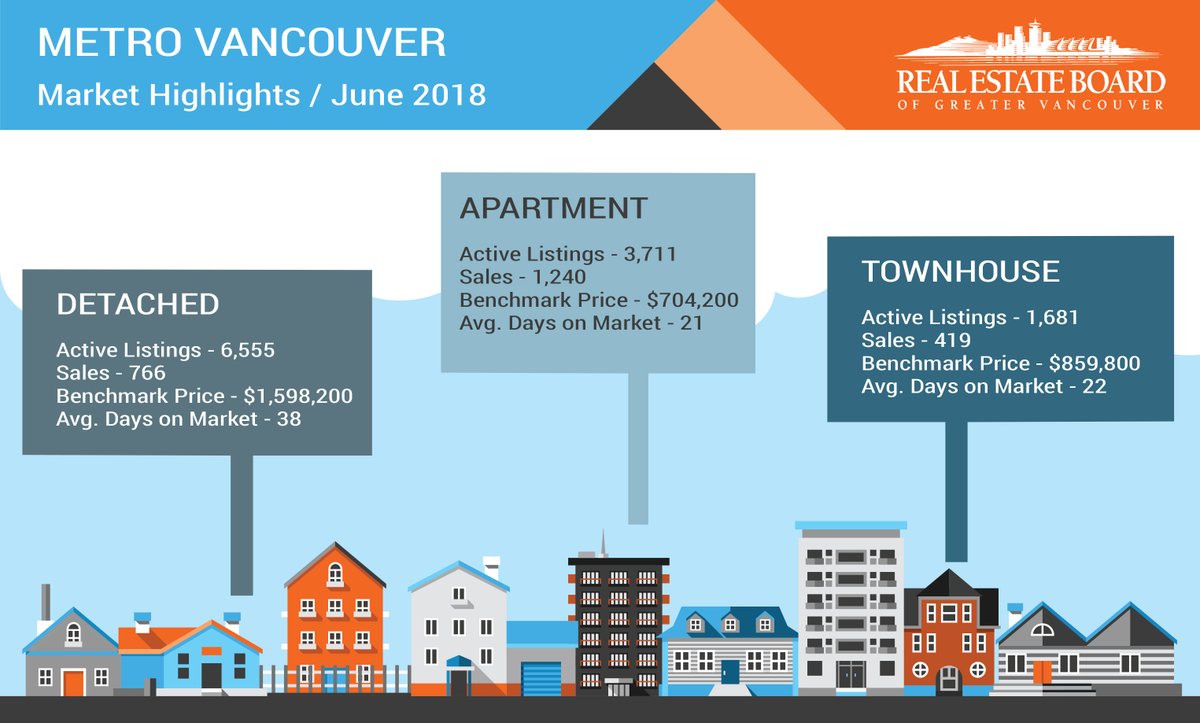
A quick snapshot of June 2018 Sales in Metro Vancouver:
Relative to May 2018, sales activity was down in all 3 categories of homes. Condos saw a small increase in their benchmark prices. Townhomes saw a miniscule $300 price increase. Detached homes averaged almost 10K decrease.
All 3 categories saw a decrease in their sales-to-listings ratios. Specifically, with a 12% S/L ratio, it is now a Buyer's Market for detached homes.
Copyright British Columbia Real Estate Association. Reprinted with permission.
Posted on
July 6, 2018
by
Steve Flynn
After two months of relatively little change, Canadian employment increased by 32,000 jobs in June and was up 1.2 per cent year-over-year. However, due to an increase in the number of people actively looking for work, the national unemployment rate rose 0.2 points to 6 per cent.
In BC, employment fell by 8,000 jobs as over 10,000 part-time positions were lost and only 2,100 full-time jobs were gained. On a year-over-year basis, employment was down 0.8 per cent. The provincial unemployment rate moved 0.4 points higher in June to 5.2 per cent.
Copyright British Columbia Real Estate Association. Reprinted with permission.
Posted on
July 5, 2018
by
Steve Flynn
I have sold a property at 301 17712 57A AVE in Surrey. LOVELY 867 sq. ft, 2 bed/2 bath, north-facing condo in charming Cloverdale. Built in 2009, this spacious, well-maintained condo features eng. h/w flooring, granite countertops & s/s appliances. Large master bedroom. Big balcony facing north & very private. Club-room w/kitchen & billiards. Very well-maintained building. Excellent location, close to everything in dt Cloverdale with an 85 Walk Score and only 1 block to transit. Quick, easy access to all major highways, KPU Tech and Willlowbrook Shopping Centre. 2 parking stalls and 2 lockers! Rentals allowed w/restrictions and 1 dog or 1 cat allowed. OPEN HOUSE: Sun. June 24, 2-4 pm.
Posted on
July 4, 2018
by
Steve Flynn
Home seller supply grows as demand declines with home sale activity dipping below long-term historical averages, the supply of homes for sale in Metro Vancouver reached a three-year high in June.
The Real Estate Board of Greater Vancouver (REBGV) reports that residential home sales in the region* totalled 2,425 in June 2018, a 37.7 per cent decline from the 3,893 sales recorded in June 2017, and a 14.4 per cent decrease compared to May 2018 when 2,833 homes sold.
Last month’s sales were 28.7 per cent below the 10-year June sales average. “Buyers are less active today. This is allowing the supply of homes for sale to accumulate to levels we haven’t seen in the last few years,” Phil Moore, REBGV president said. “Rising interest rates, high prices and more restrictive mortgage requirements are among the factors dampening home buyer activity today.”
There were 5,279 detached, attached and apartment properties newly listed for sale on the Multiple Listing Service® (MLS®) in Metro Vancouver in June 2018. This represents a 7.7 per cent decrease compared to the 5,721 homes listed in June 2017 and a 17.2 per cent decrease compared to May 2018 when 6,375 homes were listed.
The total number of homes currently listed for sale on the MLS® system in Metro Vancouver is 11,947, a 40.3 per cent increase compared to June 2017 (8,515) and a 5.8 per cent increase compared to May 2018 (11,292). This is the highest this total has been since June 2015. “With reduced demand, detached homes are entering a buyers’ market and price growth in our townhome and apartment markets is showing signs of decelerating.”
For all property types, the sales-to-active listings ratio for June 2018 is 20.3 per cent. By property type, the ratio is 11.7 per cent for detached homes, 24.9 per cent for townhomes, and 33.4 per cent for condominiums. Generally, analysts say that downward pressure on home prices occurs when the ratio dips below the 12 per cent mark for a sustained period, while home prices often experience upward pressure when it surpasses 20 per cent over several months.
The MLS® Home Price Index composite benchmark price for all residential properties in Metro Vancouver is currently $1,093,600. This represents a 9.5 per cent increase over June 2017 and is virtually unchanged from May 2018.
Sales of detached homes in June 2018 reached 766, a 42 per cent decrease from the 1,320 detached sales recorded in June 2017. The benchmark price for a detached home is $1,598,200. This represents a 0.7 per cent increase from June 2017 and a 0.6 per cent decrease compared to May 2018.
Sales of apartment homes reached 1,240 in June 2018, a 34.9 per cent decrease compared to the 1,905 sales in June 2017. The benchmark price for an apartment is $704,200. This represents a 17.2 per cent increase from June 2017 and a 0.4 per cent increase compared to May 2018.
Attached home sales in June 2018 totalled 419, a 37.3 per cent decrease compared to the 668 sales in June 2017. The benchmark price of an attached home is $859,800. This represents a 15.3 per cent increase from June 2017 and is virtually unchanged from May 2018.
* Areas covered by the Real Estate Board of Greater Vancouver include: Whistler, Sunshine Coast, Squamish, West Vancouver, North Vancouver, Vancouver, Burnaby, New Westminster, Richmond, Port Moody, Port Coquitlam, Coquitlam, Pitt Meadows, Maple Ridge, and South Delta.
Copyright British Columbia Real Estate Association. Reprinted with permission.
Categories:
Abbotsford West, Abbotsford Real Estate
|
Bolivar Heights, North Surrey Real Estate
|
Brentwood Park, Burnaby North Real Estate
|
Brighouse, Richmond Real Estate
|
Burnaby
|
Burnaby Real Estate
|
Burnaby South Real Estate
|
Cape Horn, Coquitlam Real Estate
|
Cariboo, Burnaby North Real Estate
|
Central BN, Burnaby North Real Estate
|
Central Coquitlam, Coquitlam
|
Central Coquitlam, Coquitlam Real Estate
|
Champlain Heights, Vancouver East
|
Champlain Heights, Vancouver East Real Estate
|
Cloverdale BC, Cloverdale Real Estate
|
Cloverdale BC, Surrey Real Estate
|
Cloverdale Real Estate
|
Coal Harbour, Vancouver West Real Estate
|
Coaquitlam
|
College Park PM, Port Moody Real Estate
|
Collingwood VE, Vancouver East Real Estate
|
Coquitlam
|
Coquitlam West, Coquitlam Real Estate
|
Downtown NW, New Westminster Real Estate
|
Downtown VW, Vancouver West
|
Downtown VW, Vancouver West Real Estate
|
Eagleridge, Coquitlam Real Estate
|
False Creek North, Vancouver West
|
Fraserview NW, New Westminster
|
Fraserview NW, New Westminster Real Estate
|
Fraserview VE, Vancouver East Real Estate
|
GlenBrooke North, New Westminster Real Estate
|
Grandview Surrey, Surrey Real Estate
|
Harrison Hot Springs Real Estate
|
Hastings, Vancouver East Real Estate
|
Highgate, Burnaby South Real Estate
|
Hockaday, Coquitlam Real Estate
|
January 2014 Sales in Greater Vancouver
|
Metrotown, Burnaby South Real Estate
|
New Horizons, Coquitlam Real Estate
|
New Westminster Real Estate
|
Port Moody
|
Port Moody Real Estate
|
Quay, New Westminster Real Estate
|
Queensborough, New Westminster Real Estate
|
Richmond Real Estate
|
Riverdale RI, Richmond Real Estate
|
Riverwood, Port Coquitlam Real Estate
|
Sapperton, New Westminster Real Estate
|
Simon Fraser Univer., Burnaby North Real Estate
|
Surrey
|
The Heights NW, New Westminster
|
The Heights NW, New Westminster Real Estate
|
Tsawwassen Central, Tsawwassen Real Estate
|
Uptown NW, New Westminster Real Estate
|
Uptown, New Westminster Real Estate
|
Vancouver
|
Vancouver East Real Estate
|
Videocast of January 2014 sales
|
Walnut Grove, Langley Real Estate
|
West Central, Maple Ridge Real Estate
|
West End VW, Vancouver West Real Estate
|
Whalley, North Surrey Real Estate
|
Whalley, Surrey Real Estate
|
Willoughby Heights, Langley Real Estate
|
 Subscribe with RSS Reader