Posted on
January 31, 2021
by
Steve Flynn
Canadian real GDP grew by 0.7% in November, following a 0.4% increase in the previous month. This is the seventh consecutive monthly gain since the steepest drops in Canadian history was observed in March and April. This brings GDP 3% below the February pre-pandemic level of output. Fourteen of the twenty industries reported an increase in output.
Leading the increase were the mining and oil and gas sectors (3.9%) due to higher international demand. Manufacturing was up (1.7%) as a result of higher inventory formation, and multiple global COVID-19 vaccine announcements drove activity in finance and insurance (1.3%). In contrast, declines were reported at clothing stores (-5.4%), personal care stores (-1.8%), auto dealers (-0.6%), and real estate agent and broker offices (-2.6%). Housing resale activity was down in November in the majority of large Canadian cities.
Early estimates from Statistics Canada indicate that real GDP grew by 0.3% in December. This is good news, indicating that the economy is showing resilience given the second wave of infections and lockdowns in many large provinces.
Copyright British Columbia Real Estate Association. Reprinted with permission.
Posted on
January 30, 2021
by
Steve Flynn
In the first month of 2021, Metro Vancouver’s* housing market continued the pattern set at the end of last year with home sale activity outpacing the supply of homes listed for sale:
The Real Estate Board of Greater Vancouver (REBGV) reports that residential home sales in the region totalled 2,389 in January 2021, a 52.1 per cent increase from the 1,571 sales recorded in January 2020, and a 22.8 per cent decrease from the 3,093 homes sold in December 2020.
Last month’s sales were 36.4 per cent above the 10-year January sales average. “With home sale activity well above our January average, the supply of homes for sale isn’t able to keep pace,” Colette Gerber, REBGV Chair said. “This is causing increased competition amongst home buyers and upward pressure on prices.”
There were 4,480 detached, attached and apartment properties newly listed for sale on the Multiple Listing Service® (MLS®) in Metro Vancouver in January 2021. This represents a 15.7 per cent increase compared to the 3,872 homes listed in January 2020 and an 86 per cent increase compared to December 2020 when 2,409 homes were listed. The total number of homes currently listed for sale on the MLS® system in Metro Vancouver is 8,306, a 3.6 per cent decrease compared to January 2020 (8,617) and a 2.7 per cent decrease compared to December 2020 (8,538).
For all property types, the sales-to-active listings ratio for January 2021 is 28.8 per cent. By property type, the ratio is 26.3 per cent for detached homes, 37.6 per cent for townhomes, and 27.8 per cent for apartments. Generally, analysts say downward pressure on home prices occurs when the ratio dips below 12 per cent for a sustained period, while home prices often experience upward pressure when it surpasses 20 per cent over several months.
“Shifting housing needs during the pandemic and historically low interest rates have been key drivers of demand in our market over the last six months,” Gerber said. “People who managed to enter the market a few years ago, and have seen their home values increase, are now looking to move up in the market to accommodate their changing needs.”
The MLS® Home Price Index composite benchmark price for all residential properties in Metro Vancouver is currently $1,056,600. This represents a 5.5 per cent increase compared to January 2020 and a 0.9 per cent increase compared to December 2020.
Sales of detached homes in January 2021 reached 740, a 68.6 per cent increase from the 439 detached sales recorded in January 2020. The benchmark price of a detached homes is $1,576,800. This represents a 10.8 per cent increase from January 2020 and a 1.4 per cent increase compared to December 2020.
Sales of apartment homes reached 1,195 in January 2021, a 46.8 per cent increase compared to the 814 sales in January 2020. The benchmark price of an apartment home is $680,800. This represents a 2.2 per cent increase from January 2020 and a 0.6 per cent increase compared to December 2020.
Attached home sales in January 2021 totalled 454, a 42.8 per cent increase compared to the 318 sales in January 2020. The benchmark price of an attached home is $815,800. This represents a 4.3 per cent increase from January 2020 and a 0.2 per cent increase compared to December 2020.
* Areas covered by the Real Estate Board of Greater Vancouver include: Burnaby, Coquitlam, Maple Ridge, New Westminster, North Vancouver, Pitt Meadows, Port Coquitlam, Port Moody, Richmond, South Delta, Squamish, Sunshine Coast, Vancouver, West Vancouver, and Whistler.
Copyright British Columbia Real Estate Association. Reprinted with permission.
Posted on
January 25, 2021
by
Steve Flynn
I have sold a property at 416 20728 WILLOUGHBY TOWN CENTRE DR in Langley. Top floor corner unit with panoramic view of North Shore Mountains in the Kensington with added bonus of large wrap around deck off the living room, plus separate deck off the master bdrm. 2 bdrm, 2 bath plus den condo has open plan concept, super bright with extra large windows and bdrms located at each end of the unit. Den off the kitchen with custom fitted cabinets already set up for home office. Equipped kitchen, quartz counters, custom cabinetry and lighting, 9 ft ceilings, screened windows, Pets welcome, 2 parking spaces #96-#97.Locker #62 Secured building with town center shopping and amenities right at your doorstop.
Posted on
January 23, 2021
by
Steve Flynn
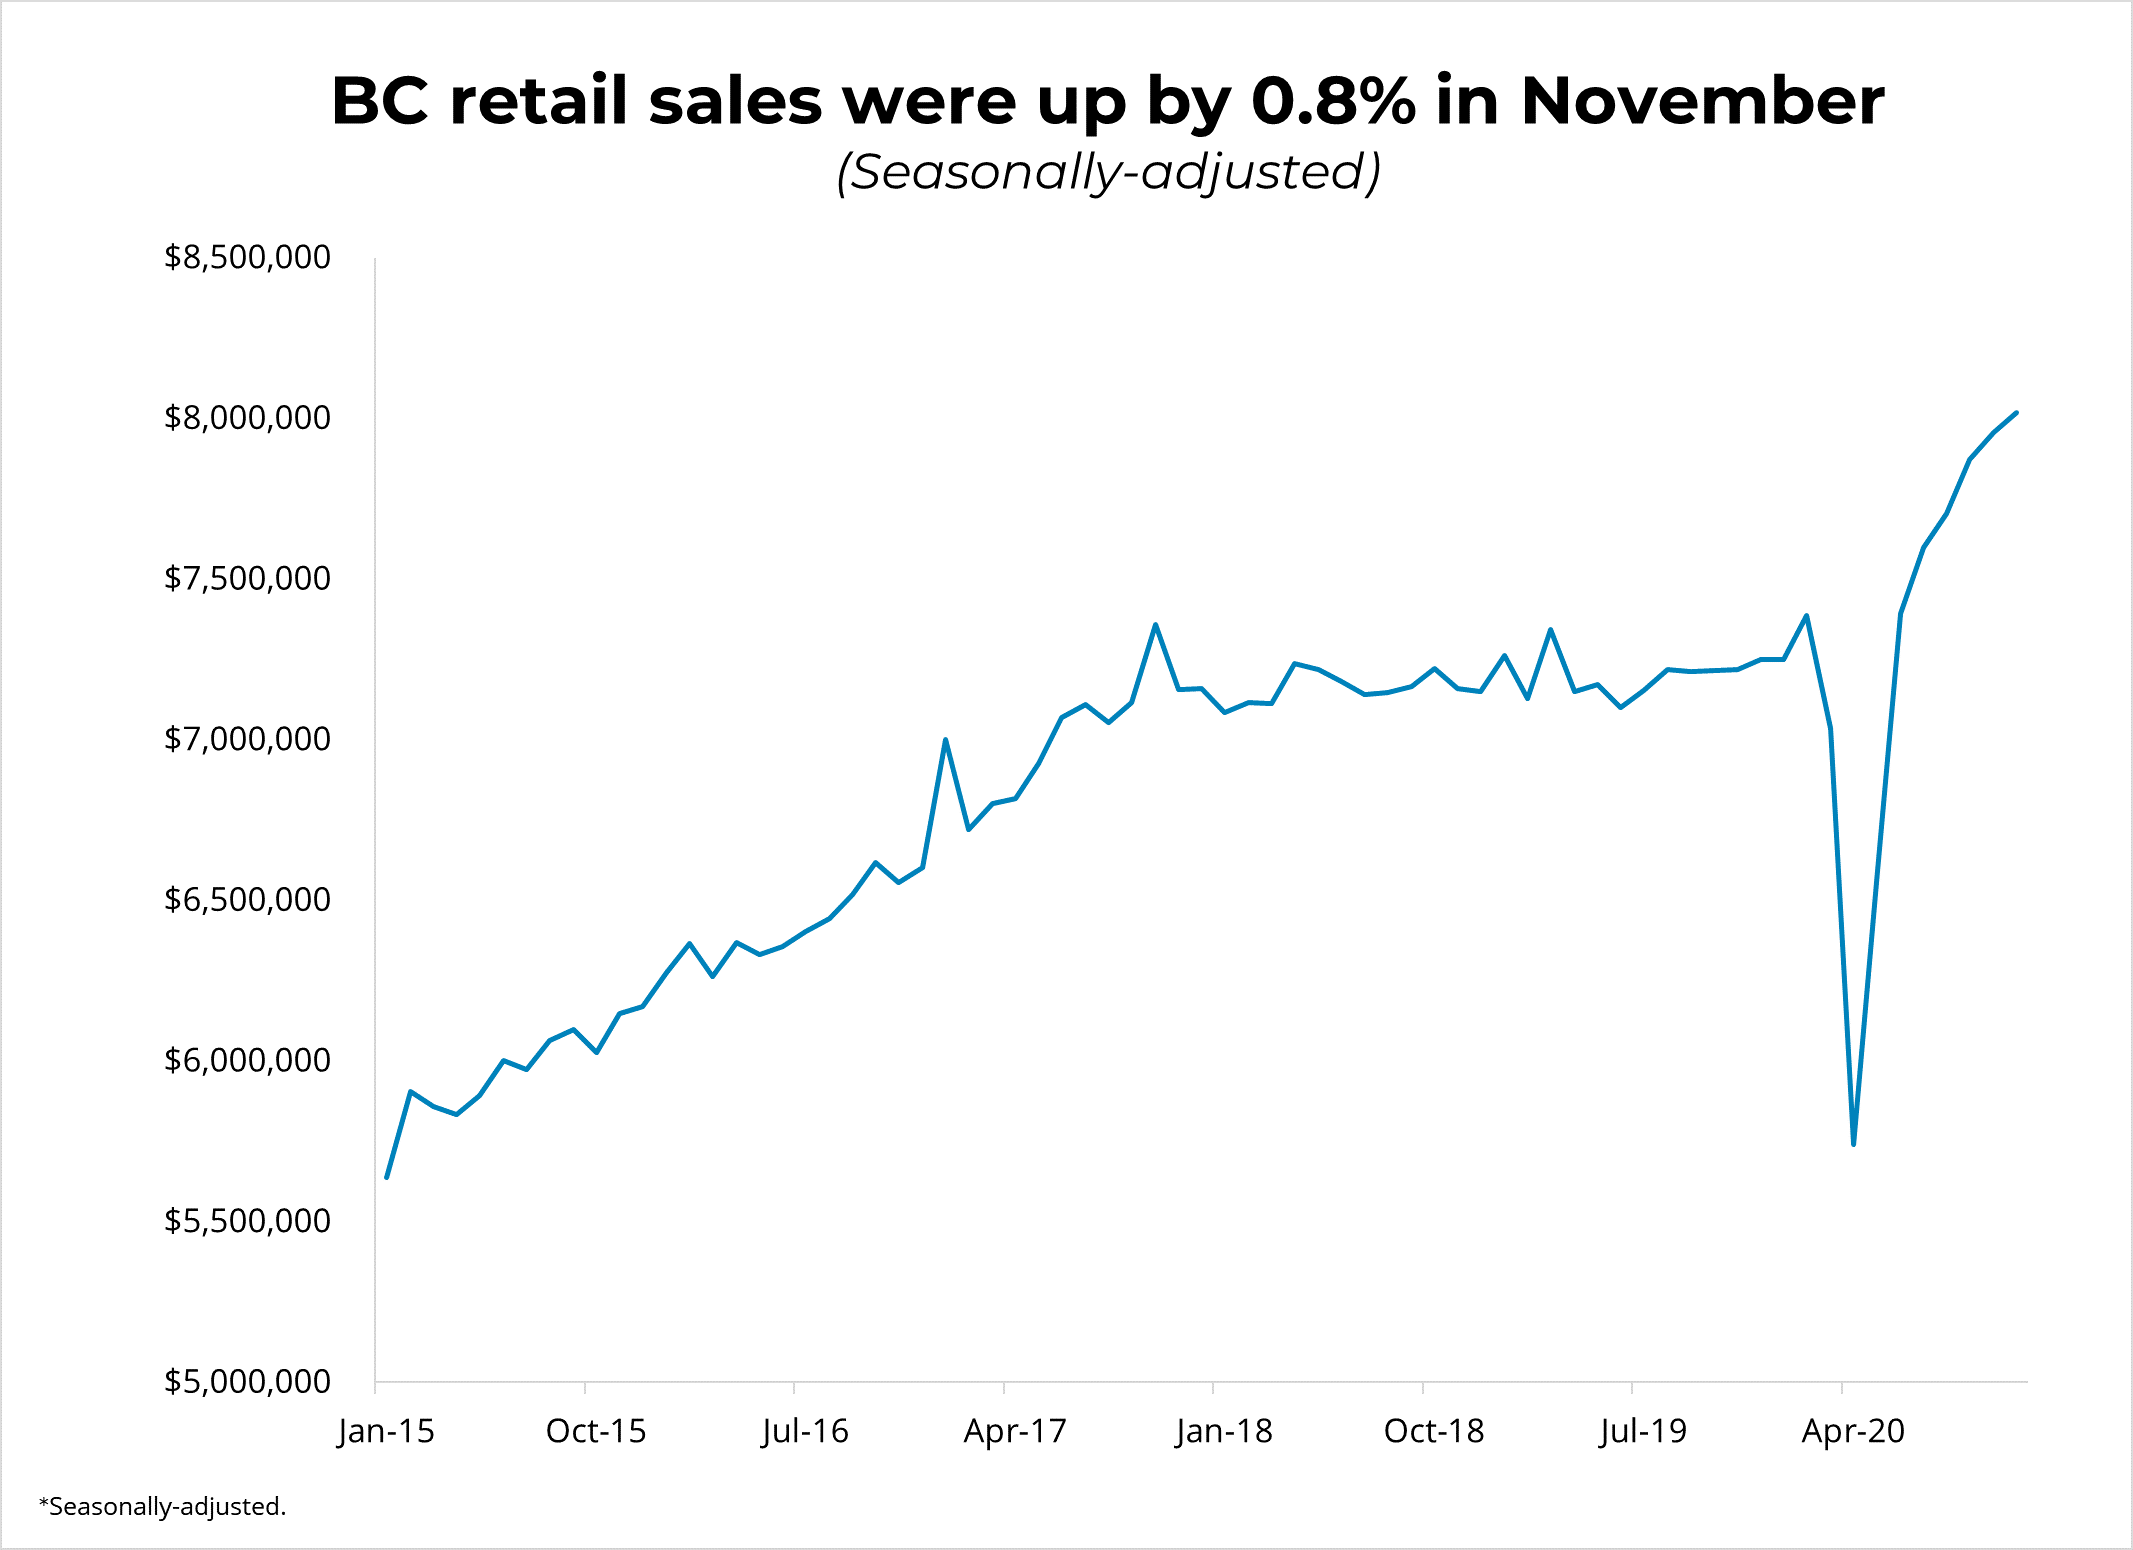
Canadian retail sales rose for the seventh consecutive month in November by 1.3% on a seasonally-adjusted basis, defying Statistic Canada's preliminary estimate of no change. Sales were up in 7 of 11 subsectors, representing 53% of retail sales. The increase was led by higher sales at food and beverage stores. Compared to the same time last year, retail sales were up by 7.5%.
Sales were up in all provinces except for Manitoba. In BC, seasonally-adjusted retail sales were up by 0.8% ($8.0 billion) and by 1.4% ($3.7 billion) in Vancouver. Contributing the most to the increase were sales at electronic and appliance stores, while sales were down at auto dealers and gas stations. Compared to the same time last year, BC retail sales were up by 11.1%.
In November, Canadian e-commerce sales totaled $4.3 billion, accounting for 7.4% of total retails sales, which is up from 5.4% in the previous month. Meanwhile, e-commerce sales were up by 76% from a year ago. This excludes Canadians purchasing from foreign e-commerce retailers.
November was a pleasant surprise in retail sales, as consumers likely pulled forward their purchases in anticipation of the holiday rush, as well as promotional events such as Black Friday. Early estimates from Statistics Canada are showing a December decline, as COVID-19 cases increase and multiple provinces implement stricter lockdown measures. Growth in retail sales is expected to slow until the vaccine becomes more widely available.
Copyright British Columbia Real Estate Association. Reprinted with permission.
Posted on
January 20, 2021
by
Steve Flynn
The Bank of Canada maintained its overnight rate at 0.25 per cent this morning, a level it considers its effective lower bound. The Bank reiterated what it calls "extraordinary forward guidance" in committing to leaving the overnight rate at 0.25 per cent until slack in the economy is absorbed and inflation sustainably returns to its 2 per cent target. The Bank projects that will not occur until 2023. The Bank is also continuing its quantitative easing (QE) program, purchasing at least $4 billion of Government of Canada bonds per week. In the statement accompanying the decision, the Bank noted that the economic recovery has been interrupted by the second wave of COVID-19, but the arrival of effective vaccines has boosted the medium-term outlook for economic growth. The Bank expects the Canadian economy will grow 4 per cent in 2021 and 5 per cent in 2022.
The restrictions in place to mitigate the impact of the second wave of COVID-19 mean that the economy is likely going to get off to a slow start in 2021. However, as vaccinations accelerate in coming months, the Canadian economic recovery will gain steam in the second half of 2021. Depending on the strength of the recovery, we may see the Bank taper its purchases of government bonds in 2022, which could put moderate upward pressure on 5-year fixed mortgage rates. However, that still means the current extremely low interest rate environment will be around for quite some time.
Copyright British Columbia Real Estate Association. Reprinted with permission.
Posted on
January 18, 2021
by
Steve Flynn
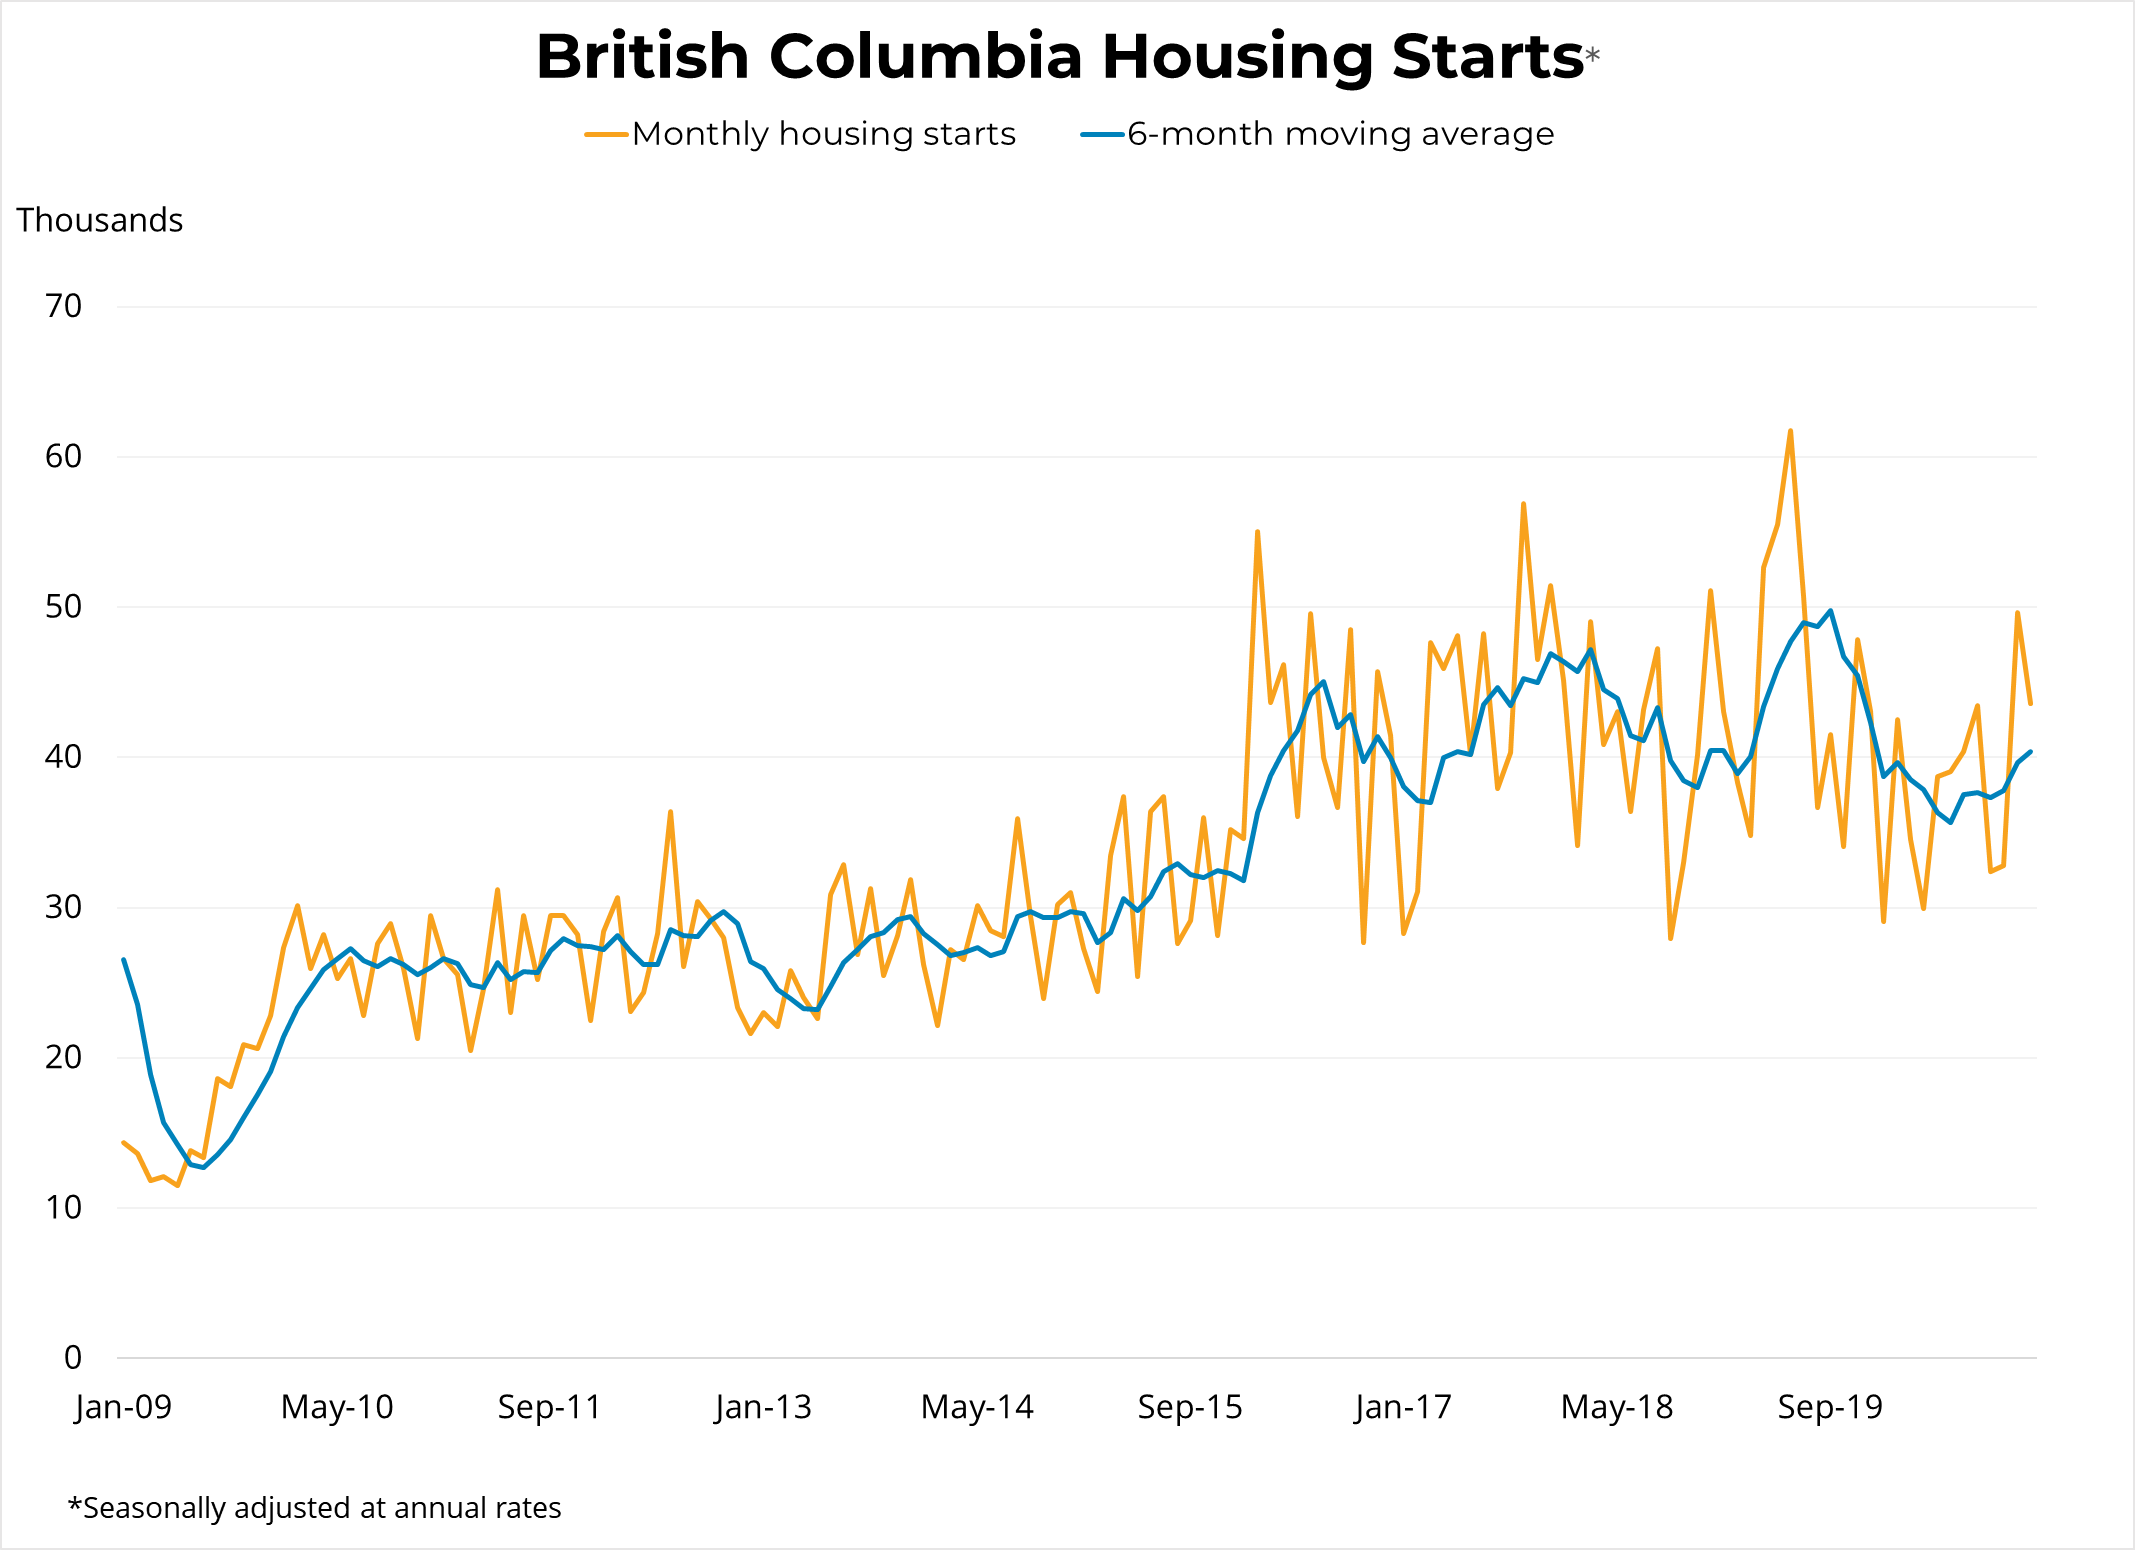
Canadian housing starts decreased by 12.6% m/m to 228,279 units in December at a seasonally adjusted annual rate (SAAR), following a strong increase of 14% in the previous month. Housing starts decreased in 8 of 10 provinces with the largest decline in Manitoba (-40.5%). Building activity declined in both the single-detached (-6.2%) and multi-unit (-15.5%) segments. Despite December's decline, housing starts finished 2020 higher than the previous year. Also, the six-month moving average was still a robust 239,052 units SAAR.
In BC, housing starts decreased by 12.1% m/m to 43,602 units SAAR in December, following a strong increase of 51% in November. Building activity was down by 15.7% in the multi-unit segment, while single-detached starts were up by 1.5%. The decline in the multi-unit segment was led by Vancouver.
The pullback in December was not unexpected as tighter COVID-19 restrictions were put in place. We can still expect housing activity to be supported by strong demand and historically low borrowing rates. The value of BC residential building permits was up by 22% in November with a strong increase in the multi-unit segment, which will contribute positively to economic growth. Compared to the same time last year, housing starts were up by 1.2% in BC.
Copyright British Columbia Real Estate Association. Reprinted with permission.
Posted on
January 16, 2021
by
Steve Flynn
Check out this very informative video of Dec 2020's MLS market activity:

Posted on
January 14, 2021
by
Steve Flynn
Vancouver, BC – January 14, 2021.
The British Columbia Real Estate Association (BCREA) reports that a total of 93,953 residential unit sales were recorded by the Multiple Listing Service® (MLS®) in 2020, an increase of 21.5 per cent from the 77,350 units sold in 2019. The annual average MLS® residential price in BC was $782,027, an 11.7 per cent increase from $700,369 recorded the previous year. Total sales dollar volume was $73.5 billion, a 35.6 per cent increase from 2019.
“Housing markets across the province staged a remarkable recovery during the COVID-19 pandemic and recession,” said BCREA Chief Economist Brendon Ogmundson. “We expect considerable momentum heading into 2021.”
A total of 8,268 MLS® residential unit sales were recorded across the province in December, a record for the month and up 57.8 per cent from December 2019. The average MLS® residential price in BC was $847,600, an increase of 12.5 per cent from December 2019. Total sales dollar volume was $7 billion, a 77.5 per cent increase year-over-year.
“While 2021 is expected to get off to a roaring start, the level of supply in the market is near a record low,” added Ogmundson. “That will likely translate to considerable pressure on prices until listings pick-up.”
Total active residential listings were down 16.1 per cent to 20,725 units in December.

Copyright British Columbia Real Estate Association. Reprinted with permission.
Posted on
January 10, 2021
by
Steve Flynn
Canadian employment lost 63k jobs in December (-0.3%, m/m), representing the first decline since April 2020. This comes on the heels of many provinces reinstating public health measures that closed recreational facilities and in-person dining services. The decline was led by part-time employment, specifically among youth aged 15 to 24 and those 55 and above. Employment declined in all provinces except for BC. The national unemployment rate ticked up by 0.1 percentage points to 8.6%, which is still a fall from the record high of 13.7% in May 2020. Compared to the same month last year, Canadian employment was down by 3.0% (-572k).
In BC, employment grew by 3.8k (0.2%, m/m) in December, following a gain of 24k in the previous month. The province continues to be at 99% of its pre-COVID February employment level. The unemployment rate ticked up by 0.1 percentage points to 7.2%, the first increase since the record high of 13.4% in May 2020. Meanwhile, in Vancouver, employment decreased by 1.1k (-0.1%, m/m). Compared to one year ago, employment in BC was down by 1.4% (-37K) jobs.
Despite rising cases of COVID-19 across the country, employment in BC bucked the trend and grew in December. Industries that saw the largest increases were construction and manufacturing, while like the rest of the country, employment fell in accommodation and food services. On the whole, we can expect national employment growth to come to a standstill as caseloads and hospitalizations increase, leaving many provinces to extend restrictions and partial lockdowns.
Copyright British Columbia Real Estate Association. Reprinted with permission.
Posted on
January 8, 2021
by
Steve Flynn
Posted on
January 6, 2021
by
Steve Flynn
Metro Vancouver housing market shows resilience in 2020:
Strong December activity brought Metro Vancouver’s* 2020 home sales total in line with the region’s long-term annual average.
The Real Estate Board of Greater Vancouver (REBGV) reports that residential home sales in the region totalled 30,944 in 2020, a 22.1 per cent increase from the 25,351 sales recorded in 2019, and a 25.7 per cent increase from the 24,619 homes sold in 2018.
Last year’s sales total was 2.8 per cent below the 10-year sales average.
“When the pandemic began in March, the housing market came to a near standstill. We knew, however, that shelter needs don’t go away in times of crisis, they intensify," Colette Gerber, REBGV Chair said. “The real estate community worked closely with our regulatory bodies and public health officials in the spring to ensure appropriate precautions and protocols were implemented so BC REALTORS® could help residents safely meet their housing needs."
Home listings on the Multiple Listing Service® (MLS®) in Metro Vancouver reached 54,305 in 2020. This is a 4.6 per cent increase compared to the 51,918 homes listed in 2019 and a 1.3 per cent increase compared to the 53,614 homes listed in 2018.
Last year’s listings total was 2.7 per cent below the region’s 10-year average.
“After adapting to the COVID-19 environment, local home buyer demand and seller supply returned at a steady pace throughout the summer, fall and winter seasons," Gerber said. "Shifting housing needs and low interest rates were key drivers of this activity in 2020. Looking ahead, the supply of homes for sale will be a critical factor in determining home price trends in 2021.”
The MLS® HPI composite benchmark price for all residential properties in Metro Vancouver ends the year at $1,047,400. This is a 5.4 per cent increase compared to December 2019.
The benchmark price for apartments increased 2.6 per cent in the region last year. Townhomes increased 4.9 per cent and detached homes increased 10.2 per cent.
* Areas covered by the Real Estate Board of Greater Vancouver include: Burnaby, Coquitlam, Maple Ridge, New Westminster, North Vancouver, Pitt Meadows, Port Coquitlam, Port Moody, Richmond, South Delta, Squamish, Sunshine Coast, Vancouver, West Vancouver, and Whistler.
Copyright British Columbia Real Estate Association. Reprinted with permission.
Posted on
January 5, 2021
by
Steve Flynn
Strong December activity brought Metro Vancouver’s* 2020 home sales total in line with the region’s long-term annual average:
The Real Estate Board of Greater Vancouver (REBGV) reports that residential home sales in the region totalled 3,093 in December 2020, a 53.4 per cent increase from the 2,016 sales recorded in December 2019, and a 0.9 per cent increase from the 3,064 homes sold in November 2020.
Last month’s sales were 57.7 per cent above the 10-year December sales average and is the highest total for the month on record. “Robust December sales outpaced long-term averages in what’s traditionally the quietest month of the year in real estate. This was part of an unusual seasonal pattern the market followed last year, which can be attributed in large part to the pandemic,” Gerber says.
There were 2,409 detached, attached and apartment properties newly listed for sale on the MLS® in Metro Vancouver in December 2020. This represents a 51.7 per cent increase compared to the 1,588 homes listed in December 2019 and a 40.8 per cent decrease compared to November 2020 when 4,068 homes were listed.
The total number of homes currently listed for sale on the MLS® system in Metro Vancouver is 8,538, a 0.8 per cent decrease compared to December 2019 (8,603) and a 23.2 per cent decrease compared to November 2020 (11,118).
For all property types, the sales-to-active listings ratio for December 2020 is 36.2 per cent. By property type, the ratio is 35.2 per cent for detached homes, 50.4 per cent for townhomes, and 33.1 per cent for apartments. Generally, analysts say downward pressure on home prices occurs when the ratio dips below 12 per cent for a sustained period, while home prices often experience upward pressure when it surpasses 20 per cent over several months.
Sales of detached homes in December 2020 reached 1,026, a 71.3 per cent increase from the 599 detached sales recorded in December 2019. The benchmark price for detached homes is $1,554,600. This represents a 10.2 per cent increase from December 2019 and a one per cent increase compared to November 2020.
Sales of apartment homes reached 1,474 in December 2020, a 40 per cent increase compared to the 1,053 sales in December 2019. The benchmark price of an apartment property is $676,500. This represents a 2.6 per cent increase from December 2019 and is unchanged from November 2020.
Attached home sales in December 2020 totalled 593, a 62.9 per cent increase compared to the 364 sales in December 2019. The benchmark price of an attached home is $813,900. This represents a 4.9 per cent increase from December 2019 and a 0.1 per cent decrease compared to November 2020.
* Areas covered by the Real Estate Board of Greater Vancouver include: Burnaby, Coquitlam, Maple Ridge, New Westminster, North Vancouver, Pitt Meadows, Port Coquitlam, Port Moody, Richmond, South Delta, Squamish, Sunshine Coast, Vancouver, West Vancouver, and Whistler.
Copyright British Columbia Real Estate Association. Reprinted with permission.
Categories:
Abbotsford West, Abbotsford Real Estate
|
Bolivar Heights, North Surrey Real Estate
|
Brentwood Park, Burnaby North Real Estate
|
Brighouse, Richmond Real Estate
|
Burnaby
|
Burnaby Real Estate
|
Burnaby South Real Estate
|
Cape Horn, Coquitlam Real Estate
|
Cariboo, Burnaby North Real Estate
|
Central BN, Burnaby North Real Estate
|
Central Coquitlam, Coquitlam
|
Central Coquitlam, Coquitlam Real Estate
|
Champlain Heights, Vancouver East
|
Champlain Heights, Vancouver East Real Estate
|
Cloverdale BC, Cloverdale Real Estate
|
Cloverdale BC, Surrey Real Estate
|
Cloverdale Real Estate
|
Coal Harbour, Vancouver West Real Estate
|
Coaquitlam
|
College Park PM, Port Moody Real Estate
|
Collingwood VE, Vancouver East Real Estate
|
Coquitlam
|
Coquitlam West, Coquitlam Real Estate
|
Downtown NW, New Westminster Real Estate
|
Downtown VW, Vancouver West
|
Downtown VW, Vancouver West Real Estate
|
Eagleridge, Coquitlam Real Estate
|
False Creek North, Vancouver West
|
Fraserview NW, New Westminster
|
Fraserview NW, New Westminster Real Estate
|
Fraserview VE, Vancouver East Real Estate
|
GlenBrooke North, New Westminster Real Estate
|
Grandview Surrey, Surrey Real Estate
|
Harrison Hot Springs Real Estate
|
Hastings, Vancouver East Real Estate
|
Highgate, Burnaby South Real Estate
|
Hockaday, Coquitlam Real Estate
|
January 2014 Sales in Greater Vancouver
|
Metrotown, Burnaby South Real Estate
|
New Horizons, Coquitlam Real Estate
|
New Westminster Real Estate
|
Port Moody
|
Port Moody Real Estate
|
Quay, New Westminster Real Estate
|
Queensborough, New Westminster Real Estate
|
Richmond Real Estate
|
Riverdale RI, Richmond Real Estate
|
Riverwood, Port Coquitlam Real Estate
|
Sapperton, New Westminster Real Estate
|
Simon Fraser Univer., Burnaby North Real Estate
|
Surrey
|
The Heights NW, New Westminster
|
The Heights NW, New Westminster Real Estate
|
Tsawwassen Central, Tsawwassen Real Estate
|
Uptown NW, New Westminster Real Estate
|
Uptown, New Westminster Real Estate
|
Vancouver
|
Vancouver East Real Estate
|
Videocast of January 2014 sales
|
Walnut Grove, Langley Real Estate
|
West Central, Maple Ridge Real Estate
|
West End VW, Vancouver West Real Estate
|
Whalley, North Surrey Real Estate
|
Whalley, Surrey Real Estate
|
Willoughby Heights, Langley Real Estate
|
 Subscribe with RSS Reader