Posted on
July 31, 2020
by
Steve Flynn
Canadian real GDP grew 4.5 per cent on a monthly basis in May. May's increase follows an 11.6 per cent contraction in April, the largest monthly decline in GDP since the series started to be recorded in 1961. Despite the rise in GDP in May the Canadian economy is still 15 per cent below its February, pre-COVID-19 level. Statistics Canada's preliminary estimate for second quarter GDP is a decline of 12 per cent from the first quarter, or an annualized decline of close to 50%.
With an increase in GDP in May and a preliminary estimate of 5 per cent growth in June, it would appear that the Canadian economy is recovering from the COVID-19 induced recession. That recovery is already well underway in BC housing markets, with home sales recovering pre-COVID-19 levels in early summer.
Copyright British Columbia Real Estate Association. Reprinted with permission.
Posted on
July 22, 2020
by
Steve Flynn
A good news report. The easing of pandemic restrictions across the country led to an 18.7% surge in seasonally-adjusted Canadian retail sales in May to $42 billion. Leading the growth was motor vehicle and parts dealers, followed by an increase in sales in almost all other subsectors. Although sales increased in May, retail sales remain 20% below pre-pandemic levels.
Sales were up in all provinces in May, the most notable increases were in Quebec (33%), Manitoba (24%), New Brunswick (21%) and Nova Scotia (20%). In BC, seasonally-adjusted retail sales were up by 12% ($6.4 billion) and by 14% ($2.8 billion) in Vancouver. Retail sales were up in all subsectors as brick and mortar stores begin to reopen, with the largest comebacks reported in clothing, and sporting and hobby. Despite the growth, sales at clothing stores are 55% below pre-pandemic levels and -24% at sporting and hobby stores.
E-commerce sales were still strong in May, up by 113% year-over-year at $3.8 billion. E-commerce comprised 8% of total retail sales in May, down from 10% in the previous month. This excludes Canadians purchasing from foreign e-commerce retailers.
Advance estimates provided by Statistics Canada for June suggest that retail sales increased by 24.5%. This reflects the gradual reopening of the majority of provinces in the country with the exception of Ontario, which was still in the early stages of reopening in June. The magnitude and consistency of recovery in Canada's retail sector will continue to depend on consumers' willingness to venture out given that confirmed COVID-19 cases are back on the rise, including in BC. Also, on how quickly individuals can return to work, and for those unemployed, to find new employment.
Copyright British Columbia Real Estate Association. Reprinted with permission.
Posted on
July 22, 2020
by
Steve Flynn
I have sold a property at 3305 RAKANNA PL in Coquitlam. PRIDE OF OWNERSHIP IS EVIDENT THROUGHOUT! ORIGINAL OWNER, 2-level Beauty is lovingly maintained, boasts 2,830 SF & sits on a generous 5984 SF flat lot. It’s SUPER CLEAN & ideally located on a great CUL-DE-SAC in the family friendly HOCKADAY NEIGHBOURHOOD! The Large TOP FLOOR has 1,646 SF, 3 Bedrooms, 2 full Baths, Family Room, Living-Dining Rooms, & a well appointed NEW KITCHEN with a full Stainless Steel Appliances Package. The ground level MAIN FLOOR offers a Bedroom, Den, full Bath, Laundry & you’ll love the HUGE REC ROOM & Gas Fireplace. The fully fenced back yard offers excellent treed privacy. MANY MANY UPDATES: New Kitchen & side fence (‘15), Window Coverings (‘15), Grass (‘17), BR Carpet (‘18), Roof (‘19). Nearby Trails, Recreation, minutes from Coquitlam Center, Skytrain...
Posted on
July 21, 2020
by
Steve Flynn
Canadian inflation, as measured by the Consumer Price Index (CPI) rose by 0.7% in June year-over-year, up from a 0.4% decline in May. June saw the fastest rise in the CPI since March 2011. Prices rose in five of eight components year-over-year, with food and shelter prices driving the increase. Rents rebounded in June, rising 0.6% from the previous month, coinciding with the easing of some pandemic related restrictions and the warmer summer months. Mortgage interest costs continued to fall in June due to declining bond yields and the Bank of Canada's low policy rate set in March. Meanwhile, the Bank of Canada's three measures of trend inflation rose by 0.1 percentage points, averaging 1.7% in June.
Regionally, the CPI was positive in all provinces except for Prince Edward Island. In BC, CPI rose by 0.5%, following a 0.2% decline in May year-over-year. Prices for food, alcohol/tobacco/cannabis, and health and personal care continued to rise in June, while downward pressure on gas prices eased up as reopening measures had people using their vehicles more.
Prices for the hardest hit components are beginning to recover, but the rising numbers in COVID-19 cases in Canada and in the US, and the high unemployment rate will likely keep price pressures stunted. This will also likely leave the Bank of Canada's policy rate low.
Copyright British Columbia Real Estate Association. Reprinted with permission.
Posted on
July 19, 2020
by
Steve Flynn
Check out this very informative video of June's MLS market:

Posted on
July 18, 2020
by
Steve Flynn
I have sold a property at 110 2418 AVON PL in Port Coquitlam. FAMILY FRIENDLY! Lovely END UNIT, 1513 sq ft, 3 bed/3 bath townhouse is located on quiet side of complex with no neighbours across/behind. OPEN concept main floor w/gourmet kitchen & bright living/dining rooms. 2 BIG bedrooms upstairs, the master has spacious ensuite & great closet space. 4-piece 2nd bath & w/d complete the upper floor. Downstairs has 3rd bed & 3rd bath, perfect for teenager or guests! Great o/d space incl: deck for morn coffee or eve bbq & lovely, shaded front yard. LINKS is a very desirable complex w/Clubhouse & serene park-like setting w/treed pathways & 4 private mini-parks, 1 w/playground! Close to schools: Blackburn Elem, Terry Fox Sec & Archbishop Carney. Walk to Fremont Village, Costco, Home Depot, Walmart, etc. Bus stop is 2 min walk. Easy drive to Lougheed & Hwy 1.
Posted on
July 15, 2020
by
Steve Flynn
The Bank of Canada held its overnight rate at 0.25 per cent this morning, a level it considers its effective lower bound. In addition, the Bank is continuing its quantitative easing program, committing to large-scale asset purchases of at least $5 billion per week of Government of Canada bonds along with continued purchases of provincial and corporate bonds. In the statement accompanying the decision, the Bank noted that the economic outlook remains extremely uncertain, but global economic activity is picking up. Financial conditions have improved, oil prices have rebounded, and pent-up demand in the Canadian economy has lead to a bounce in output and employment. The Bank expects that the Canadian economy will contract close to 8 per cent this year, but will build momentum into the second half of this year, leading to the economy growing 5.1 per cent in 2021. The Bank further noted that the economy will require extraordinary monetary policy support and the Bank will hold its policy rate at its effective lower bound until slack in the economy is absorbed and inflation has returned to its 2 per cent target.
Like the Bank, BCREA is projecting that the Canadian, and BC economy will start to recover in the third quarter. Positive signs of recovery are emerging in the housing market, with sales in BC recovering their pre-COVID-19 level in June. With the Bank committing to holding its policy rate at 25 basis points until slack in the economy is absorbed, and continuing its quantitative easing program of asset purchases, Canadian mortgage rates should remain at current historical lows for quite some time, providing a significant boost to the BC housing market.
Copyright British Columbia Real Estate Association. Reprinted with permission.
Posted on
July 14, 2020
by
Steve Flynn
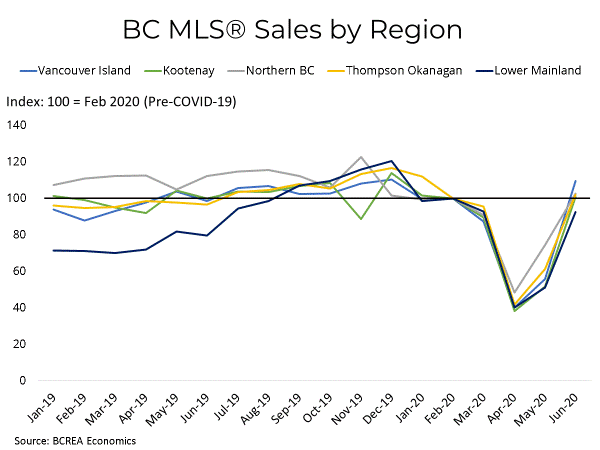
The British Columbia Real Estate Association (BCREA) reports that a total of 8,166 residential unit sales were recorded by the Multiple Listing Service® (MLS®) in June 2020, an increase of 16.9 per cent from June 2019. The average MLS® residential price in BC was $748,155, a 9.1 per cent increase from $685,968 recorded the previous year. Total sales dollar volume in June was $6.1 billion, a 27.5 per cent increase over 2019.
“Sales around the province surged back to pre-COVID-19 levels in June,” said BCREA Chief Economist Brendon Ogmundson. “While there are some temporary factors that may have pushed demand forward, we are cautiously optimistic that market activity will remain firm.”
Although listings activity has normalized along with sales, active listings are still down close to 20 per cent year-over-year and, as a result, many markets are seeing upward pressure on prices.
Year-to-date, BC residential sales dollar volume was up 0.6 per cent to $24.7 billion, compared with the same period in 2019. Residential unit sales were down 8 per cent to 32,875 units, while the average MLS® residential price was up 9.4 per cent to $751,722.
Copyright British Columbia Real Estate Association. Reprinted with permission.
Posted on
July 12, 2020
by
Steve Flynn
* Areas covered by the Real Estate Board of Greater Vancouver include: Burnaby, Coquitlam, Maple Ridge, New Westminster, North Vancouver, Pitt Meadows, Port Coquitlam, Port Moody, Richmond, South Delta, Squamish, Sunshine Coast, Vancouver, West Vancouver, and Whistler.
Copyright British Columbia Real Estate Association. Reprinted with permission.
Posted on
July 11, 2020
by
Steve Flynn
Canadian employment grew by 953,000 jobs in June (5.8%, m/m). This, combined with the increase in May, represents 40 per cent of the jobs lost in March and April. The national unemployment rate fell by 1.4 percentage points to 12.3 per cent from the previous month. The employment gains in June were somewhat evenly split between full-time work (488,000) and part-time work (465,000).
Regionally, all provinces reported an increase in employment as all had substantially eased COVID-19 measures. Ontario and Quebec made up two-thirds of the gain. Strong gains were reported in accommodation and food services, and retail, which were industries hardest hit by the pandemic. However, employment levels in these industries are still below pre-COVID levels. In June, employment rose slightly faster among women than men, but on a cumulative basis, men are at 92 per cent of pre-COVID levels, while women are at 89 per cent. Compared to the same month last year, Canadian employment was down by -8.5% (-1.6 million).
Meanwhile, employment in BC grew by 118,100 jobs (5.4%, m/m) in June, following a gain of 43,000 jobs in the previous month. Gains in the last two months represented 40 per cent of jobs lost in BC in March and April. June's employment gain brought down the unemployment rate by 0.4 percentage points to 13 per cent. Half of the employment increase was in accommodation and food services (55k), followed by professional services (18k) and retail (16k). This is consistent with the province's gradual reopening. Compared to one year ago, employment in BC was down by 10% (-267k) jobs.
This was another good news report, as it appears we continue to be on a slow path to recovery. At the same time, much of the gains were in industries that were waiting to reopen. There are still structural changes that need to work their way through the system, as some individuals who were furloughed may now be permanently unemployed. Also important are consumers' demand for goods and services, which is expected to be hampered by the still 235,000 unemployed individuals in BC.
Copyright British Columbia Real Estate Association. Reprinted with permission.
Posted on
July 10, 2020
by
Steve Flynn
Canadian housing starts increased by 8% m/m to 211,681 units in June at a seasonally adjusted annual rate (SAAR). The gain in June put starts back at pre-pandemic levels. The trend in national housing starts fell to an average of 199,700 units SAAR over the past six months. Housing starts were up in five of 10 provinces with Ontario driving the increase.
In BC, growth in housing starts was flat in June, following a 29% increase in the previous month. Historically speaking, starts in the province are still robust but have been trending downwards since the fall of 2019. Housing starts have shown resilience during the pandemic and in the near future will depend on demand as unemployment levels remain elevated and as government support programs wind down. Meanwhile, building permits for May were up by 4.4% in the province.
Looking at census metropolitan areas in BC:
- Housing starts in Vancouver were down by 5% m/m in June to 23,577 units SAAR. Multi-units were down by 9%, while singles were up by 26%. Compared to last year in June, housing starts were down by 43%, which marks the third consecutive month of negative year-over-year growth.
- In Victoria, housing starts were down by 23% m/m to 2,342 units SAAR. Compared to a year ago in June, housing starts were down by 5%.
- In Kelowna, housing starts increased by 61% m/m to 2,858. Starts were up by 1% in the region compared to the same time last year.
- Monthly housing starts in Abbotsford-Mission were up by 18% at 590 units SAAR. Compared to the same time last year, new home construction was down by 25%.
Copyright British Columbia Real Estate Association. Reprinted with permission.
Posted on
July 7, 2020
by
Steve Flynn
I have listed a new property at 110 2418 AVON PL in Port Coquitlam. FAMILY-FRIENDLY! Lovely END UNIT, 1513 sq ft, 3 bed/3 bath townhouse is located on quiet side of complex with no neighbours across/behind. OPEN concept main floor w/gourmet kitchen & bright living/dining rooms. 2 BIG bedrooms upstairs, the master has spacious ensuite & great closet space. 4-piece bath & w/d complete the upper floor. Downstairs has 3rd bed & 3rd bath, perfect for teenager or guests! Great o/d space incl: deck for morn coffee or eve bbq & lovely, shaded front yard. LINKS is a very desirable complex w/Clubhouse & serene park-like setting w/treed pathways & 4 private mini-parks, 1 w/playground! Close to schools: Blackburn Elem, Terry Fox Sec & Archbishop Carney. Walk to Freemont Village, Costco, Home Depot, Walmart, etc. Bus stop 3 min walk. Easy drive to Lougheed & Hwy 1.
Posted on
July 3, 2020
by
Steve Flynn
Steady increases in home sale and listing activity continue in June:
The Real Estate Board of Greater Vancouver (REBGV) reports that residential home sales in Metro Vancouver* totalled 2,443 in June 2020, a 17.6 per cent increase from the 2,077 sales recorded in June 2019, and a 64.5 per cent increase from the 1,485 homes sold in May 2020.
Last month’s sales were 21.9 per cent below the 10-year June sales average. “REALTORS® continue to optimize new technology tools and practices to help their clients meet their housing needs in a safe and responsible way,” Colette Gerber, REBGV Chair said “Over the last three months, home buyers and sellers have become more comfortable operating within the physical distancing and other safety protocols in place.”
There were 5,787 detached, attached and apartment properties newly listed for sale on the Multiple Listing Service® (MLS®) in Metro Vancouver in June 2020. This represents a 21.8 per cent increase compared to the 4,751 homes listed in June 2019 and a 57.1 per cent increase compared to May 2020 when 3,684 homes were listed. The total number of homes currently listed for sale on the MLS® system in Metro Vancouver is 11,424, a 23.7 per cent decrease compared to June 2019 (14,968) and a 15.1 per cent increase compared to May 2020 (9,927).
“Much more of the real estate transaction is happening virtually today. Before considering an in-person showing, REALTORS® are helping potential buyers pre-screen homes more thoroughly by taking video tours, reviewing floorplans and an increased number of high-resolution images, as well as often driving through the neighborhood.”
For all property types, the sales-to-active listings ratio for June 2020 is 21.4 per cent. By property type, the ratio is 19.9 per cent for detached homes, 25.2 per cent for townhomes, and 21.3 per cent for apartments. Generally, analysts say downward pressure on home prices occurs when the ratio dips below 12 per cent for a sustained period, while home prices often experience upward pressure when it surpasses 20 per cent over several months.
“Home prices have remained steady with minimal fluctuation over the last few months,” Gerber said. “With increasing demand, REALTORS® have begun seeing multiple offers for homes priced competitively for today’s market.” The MLS® Home Price Index composite benchmark price for all residential properties in Metro Vancouver is currently $1,025,300. This represents a 3.5 per cent increase over June 2019 and a 0.3 per cent decrease compared to May 2020.
Sales of detached homes in June 2020 reached 866, a 16.1 per cent increase from the 746 detached sales recorded in June 2019. The benchmark price for a detached home is $1,464,200. This represents a 3.6 per cent increase from June 2019 and a 0.5 per cent increase compared to May 2020.
Sales of apartment homes reached 1,105 in June 2020, a 17.4 per cent increase compared to the 941 sales in June 2019. The benchmark price of an apartment property is $680,800. This represents a 3.6 per cent increase from June 2019 and a 0.8 per cent decrease compared to May 2020.
Attached home sales in June 2020 totalled 472, a 21 per cent increase compared to the 390 sales in June 2019. The benchmark price of an attached home is $790,800. This represents a 2.3 per cent increase from June 2019 and a 0.2 per cent decrease compared to May 2020.
* Areas covered by the Real Estate Board of Greater Vancouver include: Burnaby, Coquitlam, Maple Ridge, New Westminster, North Vancouver, Pitt Meadows, Port Coquitlam, Port Moody, Richmond, South Delta, Squamish, Sunshine Coast, Vancouver, West Vancouver, and Whistler.
Copyright British Columbia Real Estate Association. Reprinted with permission.
Categories:
Abbotsford West, Abbotsford Real Estate
|
Bolivar Heights, North Surrey Real Estate
|
Brentwood Park, Burnaby North Real Estate
|
Brighouse, Richmond Real Estate
|
Burnaby
|
Burnaby Real Estate
|
Burnaby South Real Estate
|
Cape Horn, Coquitlam Real Estate
|
Cariboo, Burnaby North Real Estate
|
Central BN, Burnaby North Real Estate
|
Central Coquitlam, Coquitlam
|
Central Coquitlam, Coquitlam Real Estate
|
Champlain Heights, Vancouver East
|
Champlain Heights, Vancouver East Real Estate
|
Cloverdale BC, Cloverdale Real Estate
|
Cloverdale BC, Surrey Real Estate
|
Cloverdale Real Estate
|
Coal Harbour, Vancouver West Real Estate
|
Coaquitlam
|
College Park PM, Port Moody Real Estate
|
Collingwood VE, Vancouver East Real Estate
|
Coquitlam
|
Coquitlam West, Coquitlam Real Estate
|
Downtown NW, New Westminster Real Estate
|
Downtown VW, Vancouver West
|
Downtown VW, Vancouver West Real Estate
|
Eagleridge, Coquitlam Real Estate
|
False Creek North, Vancouver West
|
Fraserview NW, New Westminster
|
Fraserview NW, New Westminster Real Estate
|
Fraserview VE, Vancouver East Real Estate
|
GlenBrooke North, New Westminster Real Estate
|
Grandview Surrey, Surrey Real Estate
|
Harrison Hot Springs Real Estate
|
Hastings, Vancouver East Real Estate
|
Highgate, Burnaby South Real Estate
|
Hockaday, Coquitlam Real Estate
|
January 2014 Sales in Greater Vancouver
|
Metrotown, Burnaby South Real Estate
|
New Horizons, Coquitlam Real Estate
|
New Westminster Real Estate
|
Port Moody
|
Port Moody Real Estate
|
Quay, New Westminster Real Estate
|
Queensborough, New Westminster Real Estate
|
Richmond Real Estate
|
Riverdale RI, Richmond Real Estate
|
Riverwood, Port Coquitlam Real Estate
|
Sapperton, New Westminster Real Estate
|
Simon Fraser Univer., Burnaby North Real Estate
|
Surrey
|
The Heights NW, New Westminster
|
The Heights NW, New Westminster Real Estate
|
Tsawwassen Central, Tsawwassen Real Estate
|
Uptown NW, New Westminster Real Estate
|
Uptown, New Westminster Real Estate
|
Vancouver
|
Vancouver East Real Estate
|
Videocast of January 2014 sales
|
Walnut Grove, Langley Real Estate
|
West Central, Maple Ridge Real Estate
|
West End VW, Vancouver West Real Estate
|
Whalley, North Surrey Real Estate
|
Whalley, Surrey Real Estate
|
Willoughby Heights, Langley Real Estate
|
 Subscribe with RSS Reader