Posted on
June 29, 2019
by
Steve Flynn
There are positive signs that the Canadian economy is bouncing back after six months of slow growth. Output in the the Canadian economy rose 0.3 per cent in April following growth of 0.5 per cent in March. The rise in GDP was the result higher output in the mining and oil and gas sectors and well as increasing wholesale trade and construction spending. Output of offices of real estate agents and brokers was up 1.3 per cent in April due to increased resale activity, largely in Ontario.
With today's GDP report, we are tracking second quarter growth in the Canadian economy at 2.5 per cent, a major improvement from the sub-1 per cent growth of the first quarter.
Copyright British Columbia Real Estate Association. Reprinted with permission.
Posted on
June 24, 2019
by
Steve Flynn
Canadian retail sales rose in April for the third consecutive month by 0.1%, following a 1.3% gain in March (revised upwards from 1.1%). Retail spending increased to $51.5 billion, as 7 of 11 retail sub-sectors representing 74% of the sector reported higher sales. The main contributor to the increase in April was higher sales at gasoline stations. Behind the national gain were Manitoba (1.8%), Alberta (1.6%) and Ontario (0.9%).
In B.C., retail sales declined 0.5% from the previous month to $7.2 billion. Sales were down in the clothing, health and personal care, and food and beverage sectors. In contrast, sales were up in the housing related sectors of building material and garden equipment, and furniture stores. On a year-over-year basis, B.C. retail sales were flat in April.
The soft increase to retail sales in April was within market expectations, as harsher than normal weather conditions hit most of the Eastern provinces and households are still adjusting their spending to higher interest rates.
Copyright British Columbia Real Estate Association. Reprinted with permission.
Posted on
June 22, 2019
by
Steve Flynn
Canadian inflation, as measured by the Consumer Price Index (CPI), rose by 2.4 per cent compared to the same time last year. Month-over-month, seasonally adjusted prices were up 0.3 per cent, the same gain as in the previous month. Gains were reported in all major components of the CPI, while food and transportation reported the largest increases. The Bank of Canada's three measures of trend inflation were also up in May, averaging 2 per cent.
In B.C., CPI increased by 2.6 per cent in May compared to a year ago, marking the second highest provincial gain behind Manitoba. The increase was broad-based with the highest year-over-year gains reported in transportation (4.7 per cent), gasoline (3.9 per cent) and food (3.4 per cent).
The recent acceleration in inflation could complicate the Bank of Canada's decision on interest rates given the broad-based nature of the rise. That being said, much of the recent gains have been driven by seasonal and volatile factors (e.g., inclement weather and traveller accommodations), which means we can expect the Bank to remain on the sidelines.
Copyright British Columbia Real Estate Association. Reprinted with permission.
Posted on
June 19, 2019
by
Steve Flynn
Vancouver, BC - June 19, 2019.
The British Columbia Real Estate Association (BCREA) released its 2019 Second Quarter Housing Forecast today.
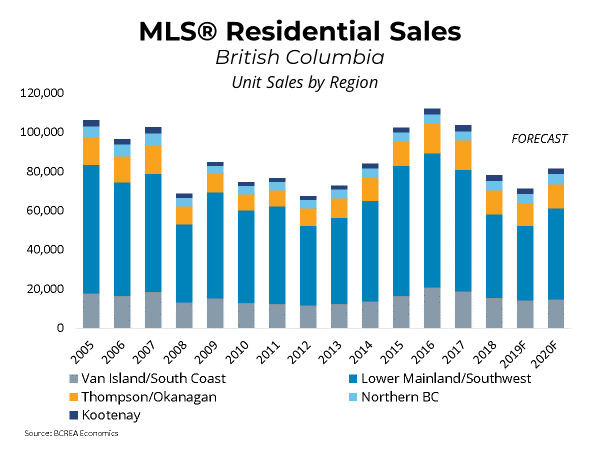
Multiple Listing Service® (MLS®) residential sales in the province are forecast to decline 9 per cent to 71,400 units this year, after recording 78,346 residential sales in 2018. MLS® residential sales are forecast to increase 14 per cent to 81,700 units in 2020. The 10-year average for MLS® residential sales in the province is 84,300 units.
The shock to affordability from restrictive mortgage policies, especially the B20 stress test, will continue to limit housing demand in the province this year, said Cameron Muir, BCREA Chief Economist. However, a relatively strong economy and favourable demographics are likely creating pent-up demand in the housing market.
The inventory of homes for sale has climbed out of a cyclical low, leading to balanced market conditions in many areas and buyer's market conditions in some communities and across some products types. Current market conditions are expected to provide little upward pressure on home prices this year, with the average annual residential price forecast to remain essentially unchanged, albeit down 2 per cent to $697,000. Modest improvement in consumer demand is expected to unfold though 2020, pushing the average residential price up 4 per cent to $726,000.
Copyright British Columbia Real Estate Association. Reprinted with permission.
Posted on
June 17, 2019
by
Steve Flynn
Vancouver, BC June 16, 2019.
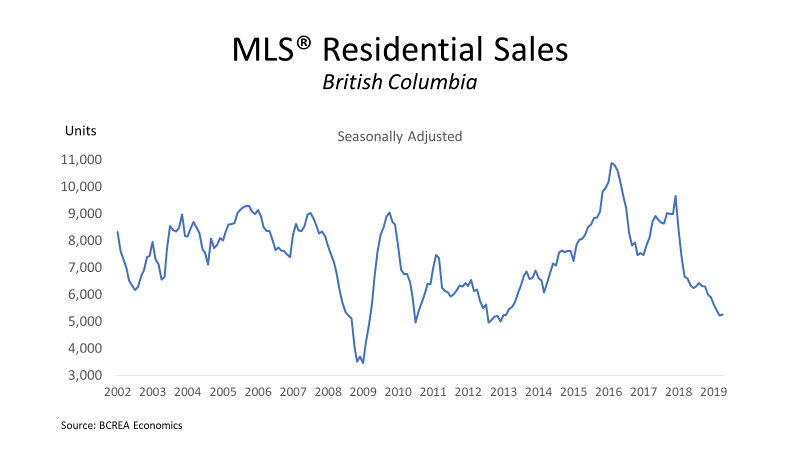
The British Columbia Real Estate Association (BCREA) reports that a total of 8,221 residential unit sales were recorded by the Multiple Listing Service® (MLS®) in May, a decline of 7 per cent from the same month last year. The average MLS® residential price in the province was $707,829, a decline of 4.3 per cent from May 2018. Total sales dollar volume was $5.8 billion, an 11 per cent decline from the same month last year.
BC home sales increased 9 per cent in May compared to April, on a seasonally adjusted basis, said BCREA Chief Economist Cameron Muir. However, consumers continue to struggle with the negative shock to affordability that stringent mortgage lending policies have created.
Total MLS® residential active listings were up 23.2 per cent to 41,519 units compared to the same month last year. However, total active listings were down 2 per cent from April, on a seasonally adjusted basis, the first monthly decline since the B20 Stress test was introduced in January 2018.
Year-to-date, BC residential sales dollar volume was down 25.1 per cent to $19.8 billion, compared with the same period in 2018. Residential unit sales decreased 20.2 per cent to 28,711 units, while the average MLS® residential price was down 6.2 per cent to $688,339.
Copyright British Columbia Real Estate Association. Reprinted with permission.
Posted on
June 14, 2019
by
Steve Flynn
Click on the video for a very informative review of May's market:

Posted on
June 10, 2019
by
Steve Flynn
Canadian housing starts decreased by 13 per cent on a monthly basis in May to 202,337 units at a seasonally adjusted annual rate (SAAR). This decline follows a strong rebound reported in the previous month. The trend in Canadian housing starts was down, averaging 202,000 units SAAR over the past six months, which is still a robust trend.
In BC, total housing starts were up 8 per cent on a monthly basis to 53,352 units SAAR. Total starts were up 31 per cent compared to May of last year. On a monthly basis, starts of multiple units were up 12 per cent to 46,020 units SAAR, while single detached starts fell by 11 per cent to 7,332 units SAAR.
Looking at census metropolitan areas in BC:
- Total starts in Vancouver were up 25 per cent on a monthly basis in May at 42,667 units SAAR, as multiple unit starts rose by 29 per cent from the previous month. Compared to last year in May, housing starts in Vancouver were up 60 per cent.
- In Victoria, housing starts were down by 57 per cent on a monthly basis to 2,311 units SAAR, mostly due to a decline from last month's spike in multiple unit starts. Compared to a year ago, housing starts are down 28 per cent.
- In Kelowna, starts increased by 28 per cent on a monthly basis, though were still relatively low at just 1,025 units SAAR. Year-over-year, total starts were down by 72 per cent as inventory of unsold units accumulate, constraining further new construction projects. This is the risk we outlined when the provincial speculation tax was introduced.
- Housing starts in the Abbotsford-Mission were up by 76 per cent in May at 1,772 units SAAR. However, on a year-over-year basis, new home construction was up more than double due to strong multiple unit starts.
Copyright British Columbia Real Estate Association. Reprinted with permission.
Posted on
June 7, 2019
by
Steve Flynn
The Canadian labour market added 27,700 jobs in May, above market expectations. This follows the 107,000 increase the previous month, placing 2019 off to a good start with employment up by about 250,000 year to date. The unemployment rate decreased by 0.3 percentage points to 5.4 per cent, which is the lowest since the series began in 1976. The gains in May were mostly in full-time employment, led by the service sector. Among the provinces, Ontario and B.C. were the primary contributors.
In BC, employment grew by 17,000 jobs in May, led by an increase in full-time employment. The unemployment rate declined to 4.3 per cent, as more people participated in the labour market. Compared to one year ago, employment in BC grew by 4.3 per cent (107,000).
Copyright British Columbia Real Estate Association. Reprinted with permission.
Posted on
June 5, 2019
by
Steve Flynn
Posted on
June 4, 2019
by
Steve Flynn
Monthly Metro Vancouver* home sales eclipsed 2,000 for the first time this year in May, although home buyer demand remains below historical averages:
The Real Estate Board of Greater Vancouver (REBGV) reports that residential home sales in the region totalled 2,638 in May 2019, a 6.9 per cent decrease from the 2,833 sales recorded in May 2018, and a 44.2 per cent increase from the 1,829 homes sold in April 2019.
Last month’s sales were 22.9 per cent below the 10-year May sales average and was the lowest total for the month since 2000. “High home prices and mortgage qualification issues caused by the federal government’s B20 stress test remain significant factors behind the reduced demand that the market is experiencing today,” Ashley Smith, REBGV president said.
There were 5,861 detached, attached and apartment properties newly listed for sale on the Multiple Listing Service® (MLS®) in Metro Vancouver last month. This represents an 8.1 per cent decrease compared to the 6,375 homes listed in May 2018 and a 2.1 per cent increase compared to April 2019 when 5,742 homes were listed.
The total number of homes currently listed for sale on the MLS® system in Metro Vancouver is 14,685, a 30 per cent increase compared to May 2018 (11,292) and a 2.3 per cent increase compared to April 2019 (14,357). This is the highest number of homes listed for sale since September 2014 (14,832).
“Whether you’re a buyer looking to make an offer or a seller looking to list your home, getting your pricing right is the key in today’s market,” Smith said. “To be competitive, it’s important to work with your local REALTOR® to assess and understand the latest trends in your neighbourhood and property type of choice.”
For all property types, the sales-to-active listings ratio for May 2019 is 18 per cent. By property type, the ratio is 14.2 per cent for detached homes, 20 per cent for townhomes, and 21.2 per cent for apartments. Generally, analysts say downward pressure on home prices occurs when the ratio dips below 12 per cent for a sustained period, while home prices often experience upward pressure when it surpasses 20 per cent over several months.
The MLS® Home Price Indexcomposite benchmark price for all residential homes in Metro Vancouver is currently $1,006,400. This represents an 8.9 per cent decrease over May 2018, a 3.4 per cent decrease over the past six months, and a 0.4 per cent decrease compared to April 2019.
Sales of detached homes in May 2019 reached 913, a 1.4 per cent decrease from the 926 detached sales recorded in May 2018. The benchmark price for a detached home in the region is $1,421,900. This represents an 11.5 per cent decrease from May 2018, a 5.4 per cent decrease over the past six months, and a 0.5 per cent decrease compared to April 2019.
Sales of apartment homes reached 1,246 in May 2019, a 12.9 per cent decrease compared to the 1,431 sales in May 2018. The benchmark price of an apartment property is $664,200. This represents a 7.3 per cent decrease from May 2018, a two per cent decrease over the past six months, and a 0.5 per cent decrease compared to April 2019.
Attached home sales in May 2019 totalled 479, a 0.6 per cent increase compared to the 476 sales in May 2018. The benchmark price of an attached unit is $779,400. This represents a 7.6 per cent decrease from May 2018, a 3.5 per cent decrease over the past six months, and a 0.6 per cent increase compared to April 2019.
* Areas covered by the Real Estate Board of Greater Vancouver include: Burnaby, Coquitlam, Maple Ridge, New Westminster, North Vancouver, Pitt Meadows, Port Coquitlam, Port Moody, Richmond, South Delta, Squamish, Sunshine Coast, Vancouver, West Vancouver, and Whistler.
Copyright British Columbia Real Estate Association. Reprinted with permission.
Categories:
Abbotsford West, Abbotsford Real Estate
|
Bolivar Heights, North Surrey Real Estate
|
Brentwood Park, Burnaby North Real Estate
|
Brighouse, Richmond Real Estate
|
Burnaby
|
Burnaby Real Estate
|
Burnaby South Real Estate
|
Cape Horn, Coquitlam Real Estate
|
Cariboo, Burnaby North Real Estate
|
Central BN, Burnaby North Real Estate
|
Central Coquitlam, Coquitlam
|
Central Coquitlam, Coquitlam Real Estate
|
Champlain Heights, Vancouver East
|
Champlain Heights, Vancouver East Real Estate
|
Cloverdale BC, Cloverdale Real Estate
|
Cloverdale BC, Surrey Real Estate
|
Cloverdale Real Estate
|
Coal Harbour, Vancouver West Real Estate
|
Coaquitlam
|
College Park PM, Port Moody Real Estate
|
Collingwood VE, Vancouver East Real Estate
|
Coquitlam
|
Coquitlam West, Coquitlam Real Estate
|
Downtown NW, New Westminster Real Estate
|
Downtown VW, Vancouver West
|
Downtown VW, Vancouver West Real Estate
|
Eagleridge, Coquitlam Real Estate
|
False Creek North, Vancouver West
|
Fraserview NW, New Westminster
|
Fraserview NW, New Westminster Real Estate
|
Fraserview VE, Vancouver East Real Estate
|
GlenBrooke North, New Westminster Real Estate
|
Grandview Surrey, Surrey Real Estate
|
Harrison Hot Springs Real Estate
|
Hastings, Vancouver East Real Estate
|
Highgate, Burnaby South Real Estate
|
Hockaday, Coquitlam Real Estate
|
January 2014 Sales in Greater Vancouver
|
Metrotown, Burnaby South Real Estate
|
New Horizons, Coquitlam Real Estate
|
New Westminster Real Estate
|
Port Moody
|
Port Moody Real Estate
|
Quay, New Westminster Real Estate
|
Queensborough, New Westminster Real Estate
|
Richmond Real Estate
|
Riverdale RI, Richmond Real Estate
|
Riverwood, Port Coquitlam Real Estate
|
Sapperton, New Westminster Real Estate
|
Simon Fraser Univer., Burnaby North Real Estate
|
Surrey
|
The Heights NW, New Westminster
|
The Heights NW, New Westminster Real Estate
|
Tsawwassen Central, Tsawwassen Real Estate
|
Uptown NW, New Westminster Real Estate
|
Uptown, New Westminster Real Estate
|
Vancouver
|
Vancouver East Real Estate
|
Videocast of January 2014 sales
|
Walnut Grove, Langley Real Estate
|
West Central, Maple Ridge Real Estate
|
West End VW, Vancouver West Real Estate
|
Whalley, North Surrey Real Estate
|
Whalley, Surrey Real Estate
|
Willoughby Heights, Langley Real Estate
|
 Subscribe with RSS Reader