Posted on
March 31, 2021
by
Steve Flynn
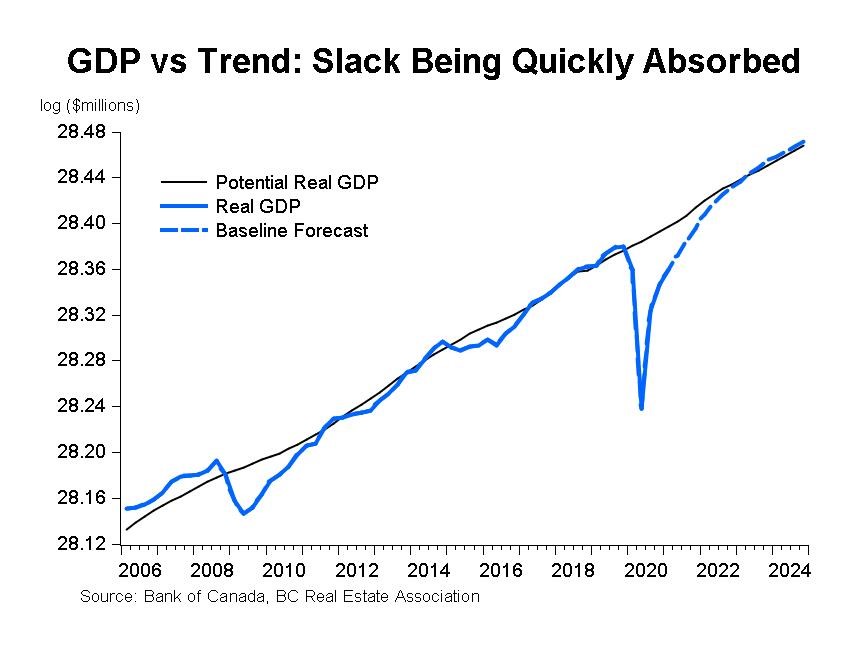
It was a strong start for the Canadian economy as real GDP expanded 0.7 per cent on a monthly basis in January. The increase in January marks the ninth consecutive month of positive economic growth, however, total economic activity is still about 3 per cent below its pre-COVID-19 level. With the strong start to 2021, first quarter real GDP growth is tracking at 5.5 per cent on an annualized basis.
An acceleration of vaccinations appears to be on the immediate horizon. As that roll-out progresses, we expect pent-up spending throughout the economy to be unleashed, driving a strong economic recovery. Following an unprecedented contraction in 2020, we expect the Canadian economy will enjoy two years of very strong growth with the economy expanding by more than 5 per cent this year and about 4.5 per cent in 2022.
Copyright British Columbia Real Estate Association. Reprinted with permission.
Posted on
March 18, 2021
by
Steve Flynn
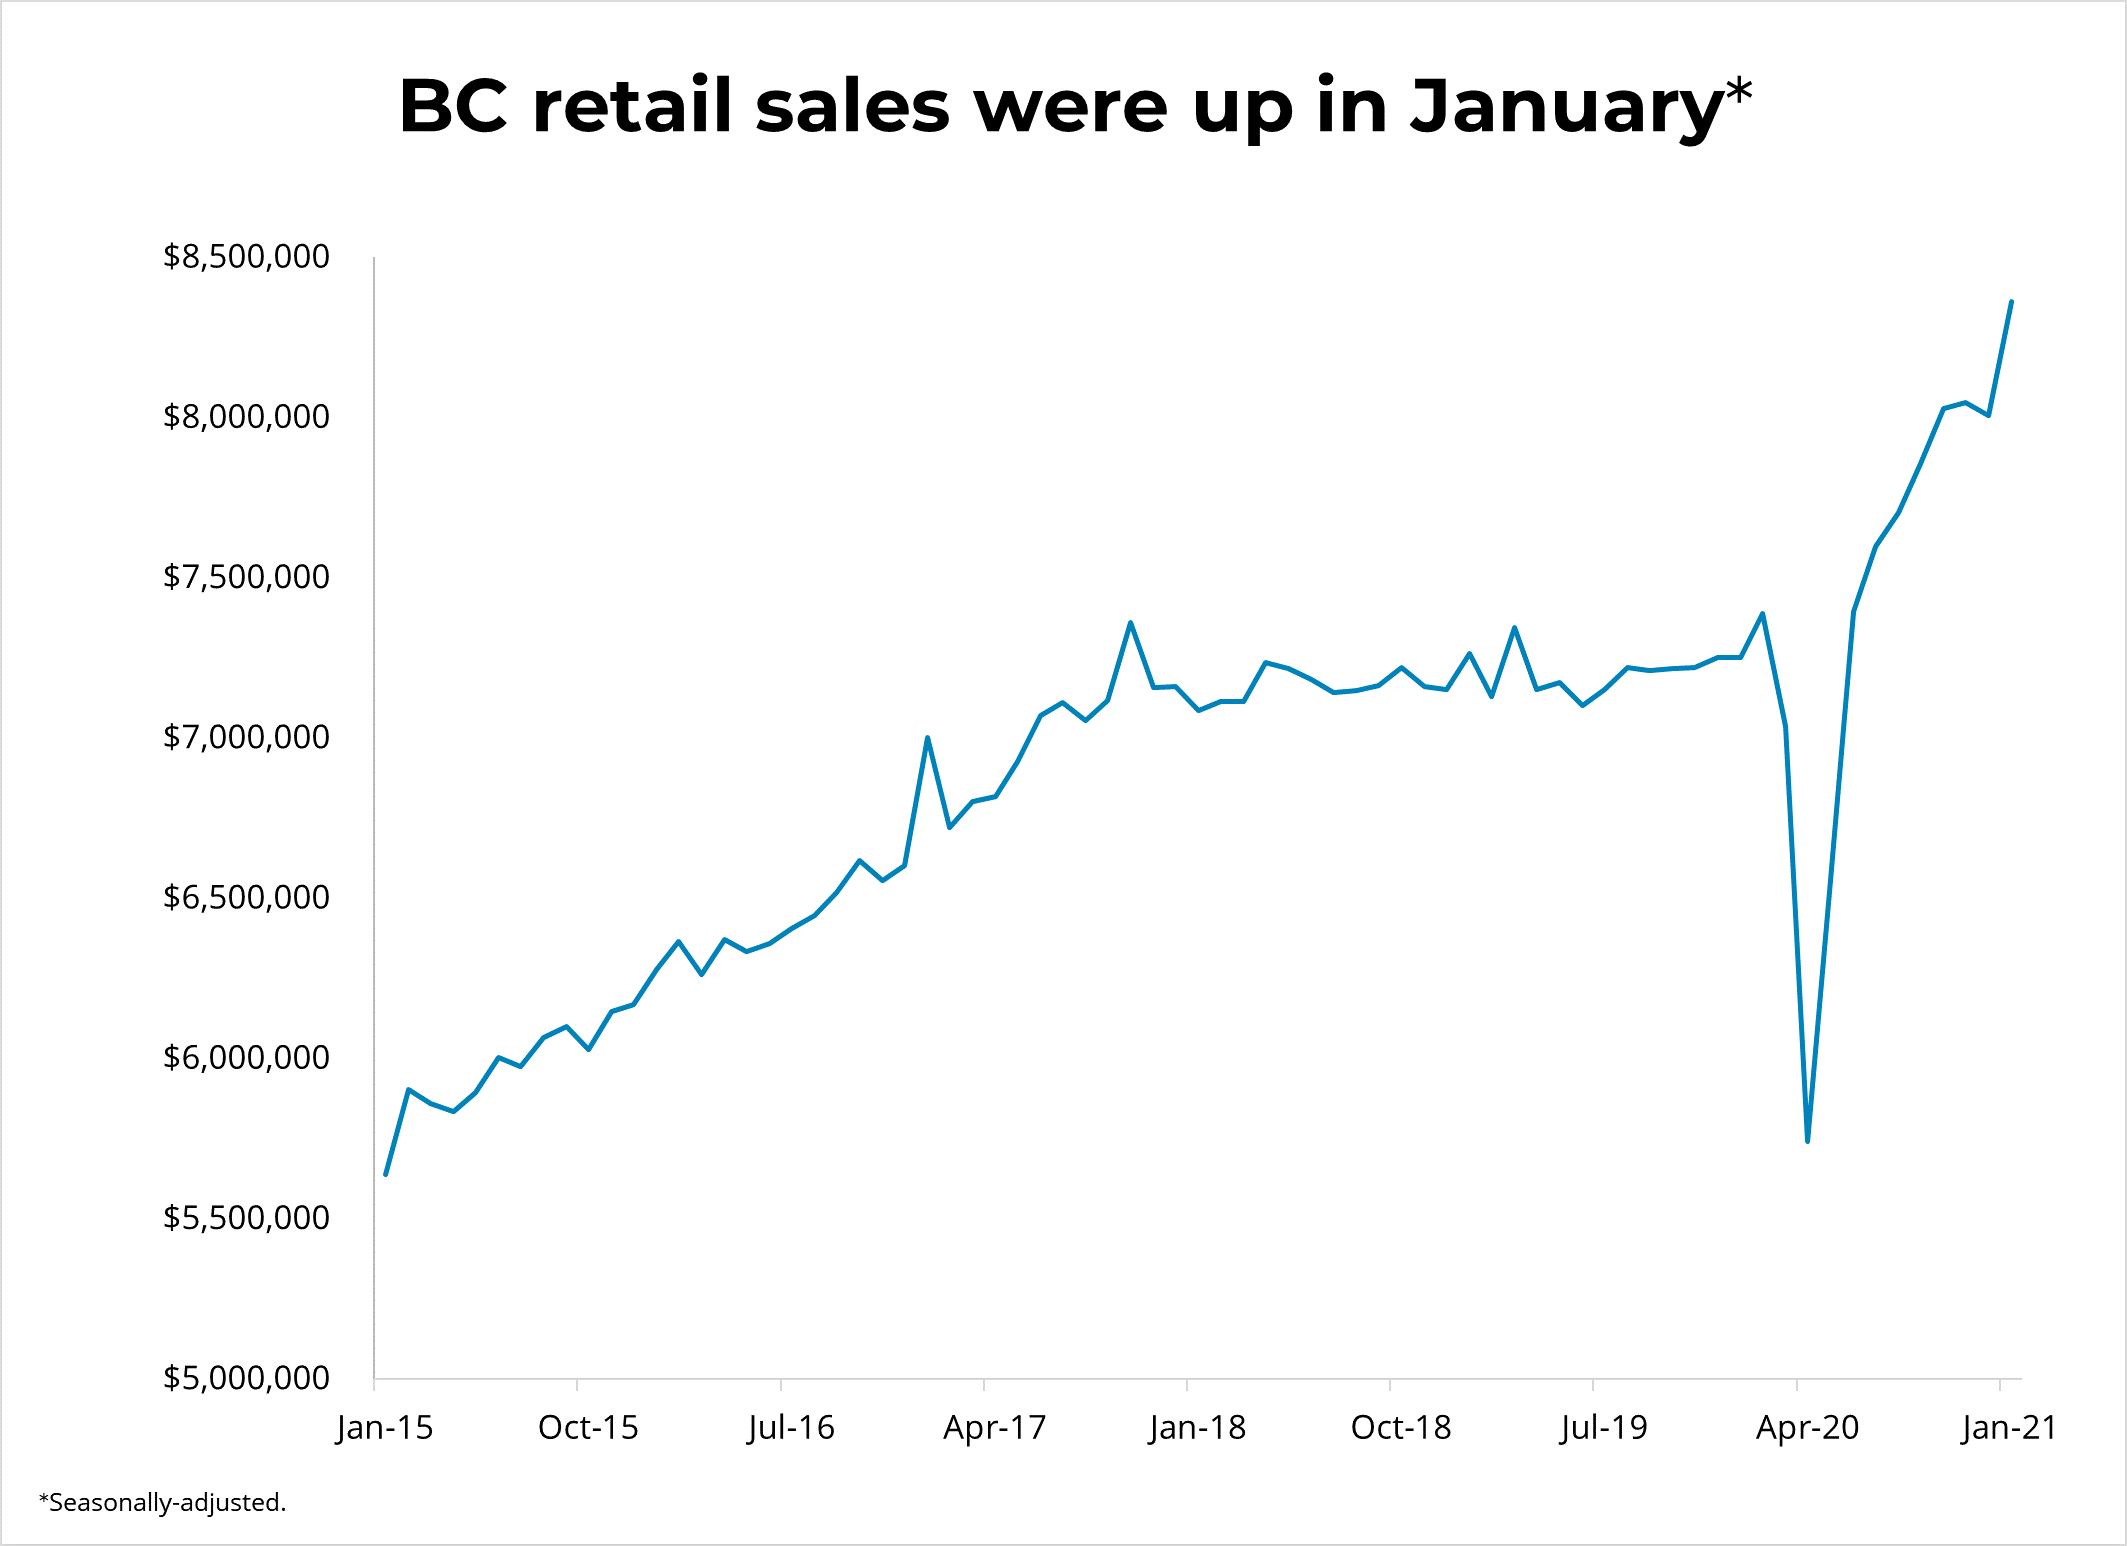
Canadian retail sales fell in January by 1.1% m/m on a seasonally-adjusted basis. This is the second consecutive monthly decline since April 2020. Sales were down in 6 of 11 subsectors, representing 39% of retail sales. Clothing and clothing accessories stores led the decline, down for a fourth consecutive month. Notable declines were also reported at furniture and home furnishing stores. Compared to the same time last year, retail sales were up by 1.3%.
Sales were down mainly in Quebec and Ontario, where stricter lockdown measures were in place. In BC, seasonally-adjusted retail sales rose by 4.4% m/m ($8.4 billion) and by 4.4% m/m ($3.7 billion) in Vancouver. On a non-seasonally adjusted basis, contributing to the increase were sales at auto dealers and gasoline stations. BC retail sales were up by 14.5% compared to the same time last year.
In January, Canadian e-commerce sales totaled $3.5 billion, accounting for 7.8% of total retail sales, down from 8.1% in the previous month. E-commerce sales were up by 111% from a year ago. This excludes Canadians purchasing from foreign e-commerce retailers.
With the resurgence of COVID-19 cases in Canada, provincial governments began to reintroduce lockdown measures, which directly affected the retail sector. Approximately 14% of retailers were closed at some point in January for an average of three business days. Statistics Canada's preliminary estimate for February suggests that retail sales increased by 4%. Growth in retail sales is expected to bounce back as the vaccine rollout accelerates and pent-up consumption is unleashed.
Copyright British Columbia Real Estate Association. Reprinted with permission.
Posted on
March 18, 2021
by
Steve Flynn
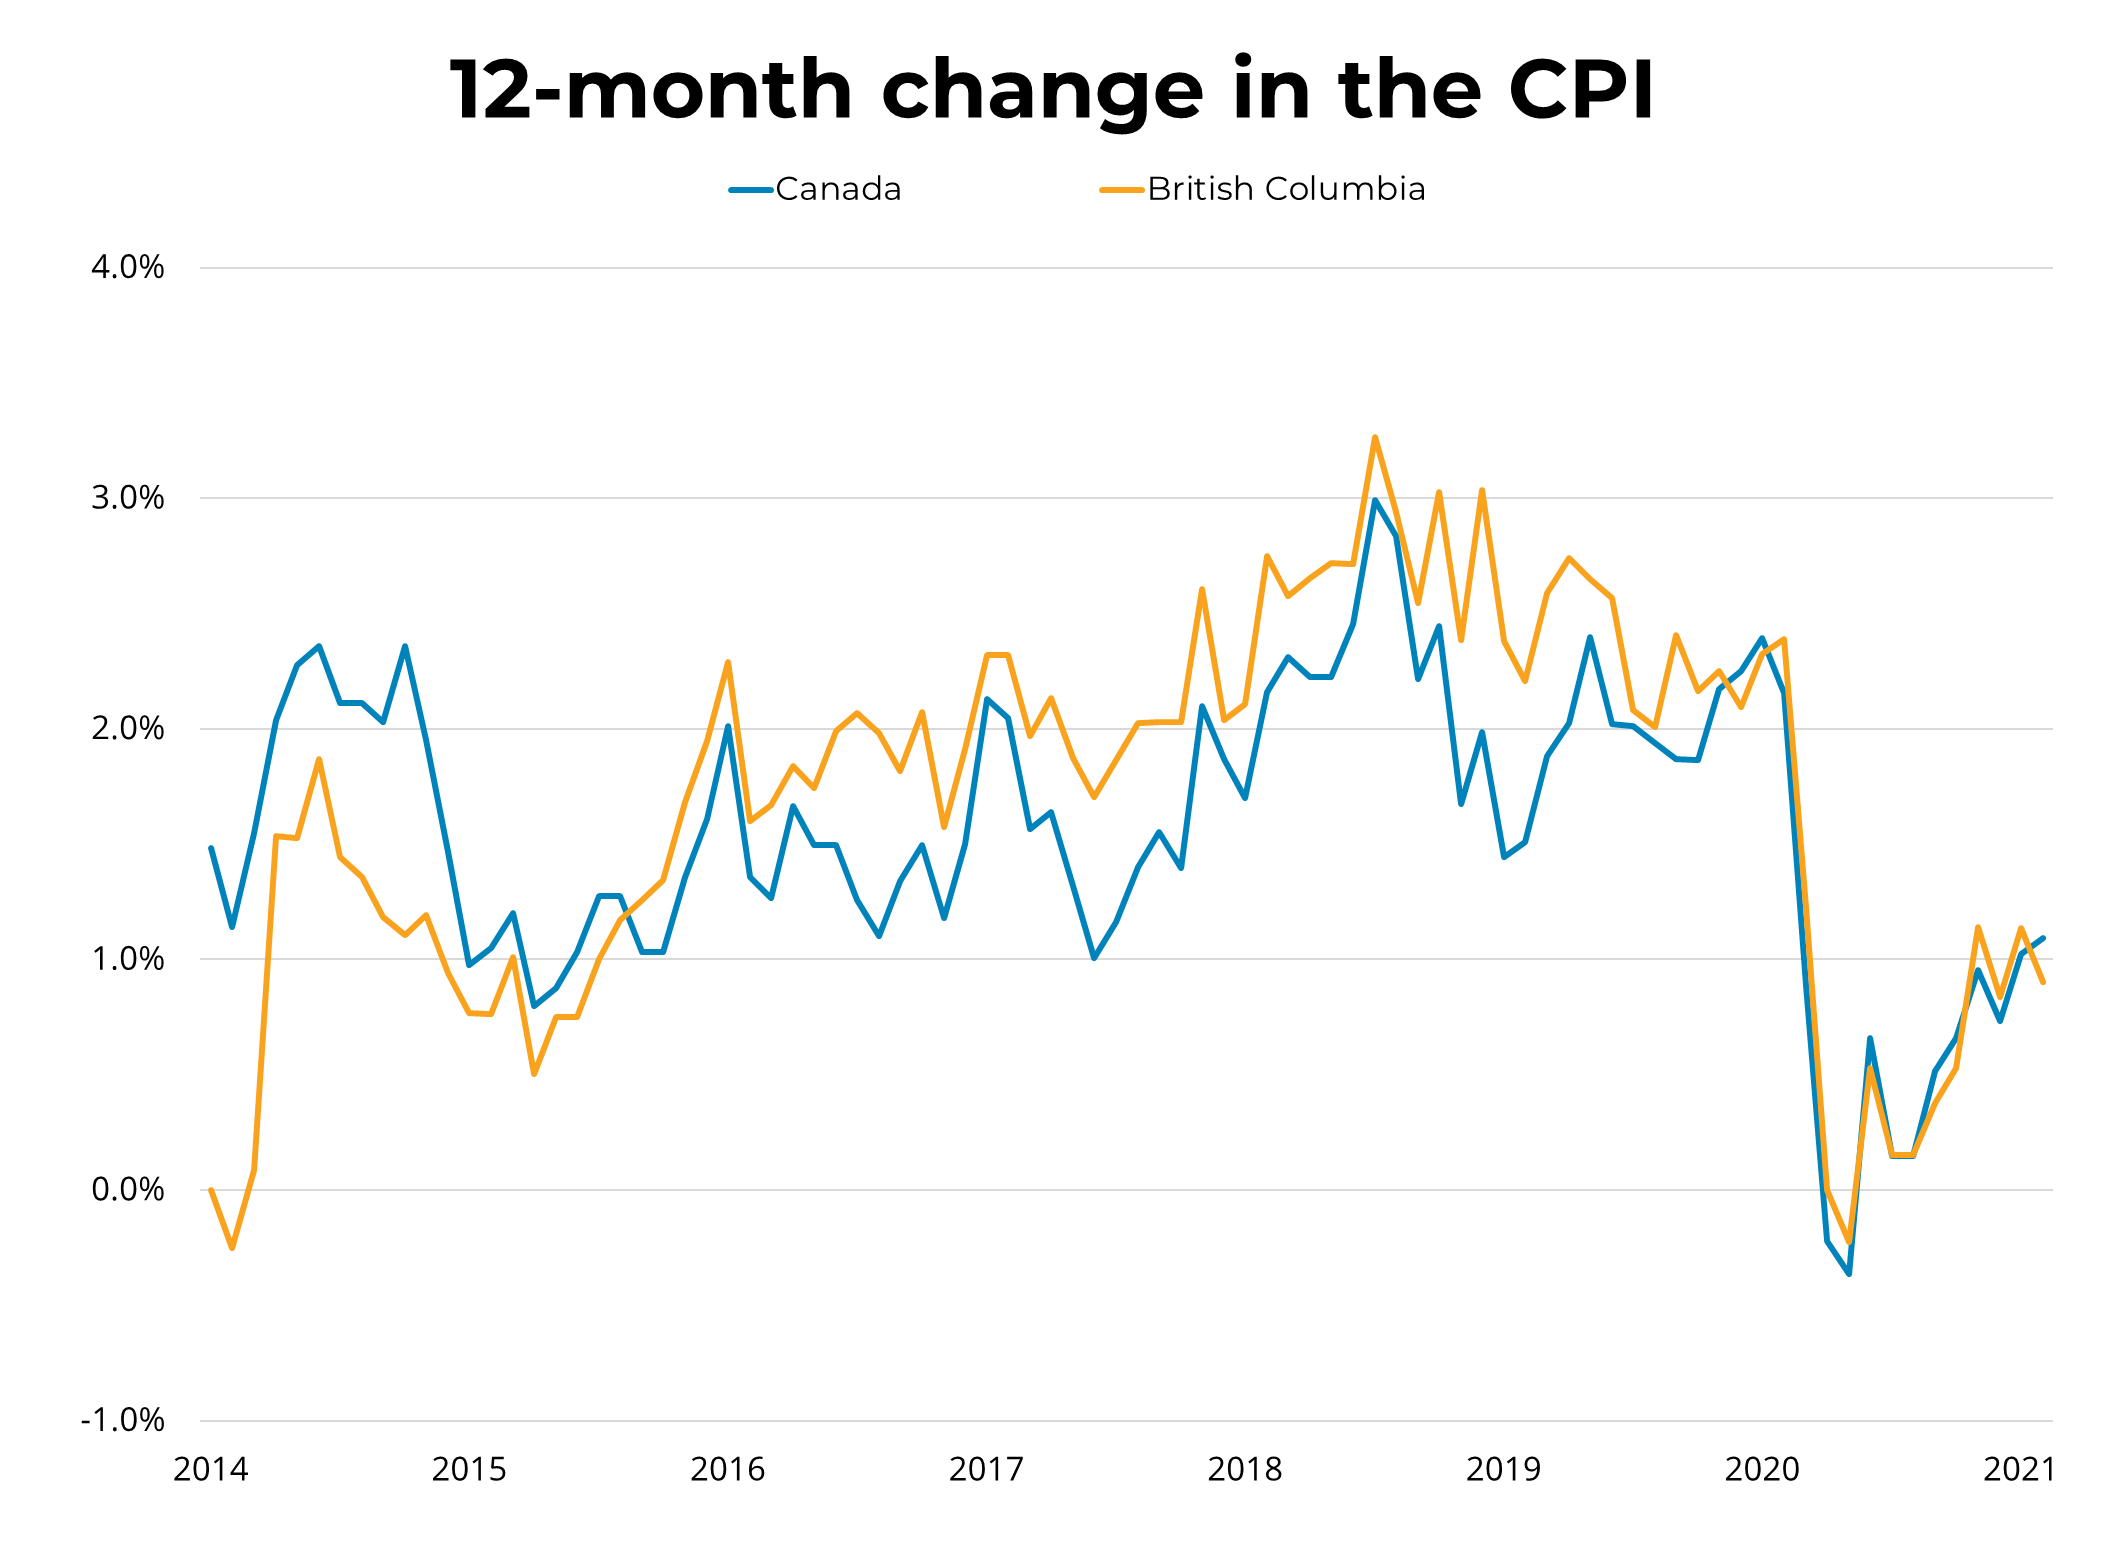
Canadian inflation, as measured by the Consumer Price Index (CPI) rose by 1.1% in February year-over-year. The increase was again due to higher gasoline prices (5%). Excluding the volatile gasoline component, the CPI rose by 1%, which is down from 1.3% in January. Prices rose in all components of the CPI except for clothing and footwear. Growth in the Bank of Canada's three measures of trend inflation remained unchanged, averaging 1.7%.
Regionally, the CPI was positive in all provinces, led by Quebec (1.6%). In BC, CPI rose by 0.9% in February year-over-year, down from January's 1.1%. Strong price growth continued for health and personal care, shelter, and food. Transportation costs reported the first notable increase since the pandemic started.
Gas prices were again the driving force behind inflation growth in February. It will continue to do so for the foreseeable future, as oil producers tighten supply. Despite this, the Bank of Canada has indicated that it will not raise rates until the economy is back at full employment and inflation is sustained at its 2% target rate.
Copyright British Columbia Real Estate Association. Reprinted with permission.
Posted on
March 16, 2021
by
Steve Flynn
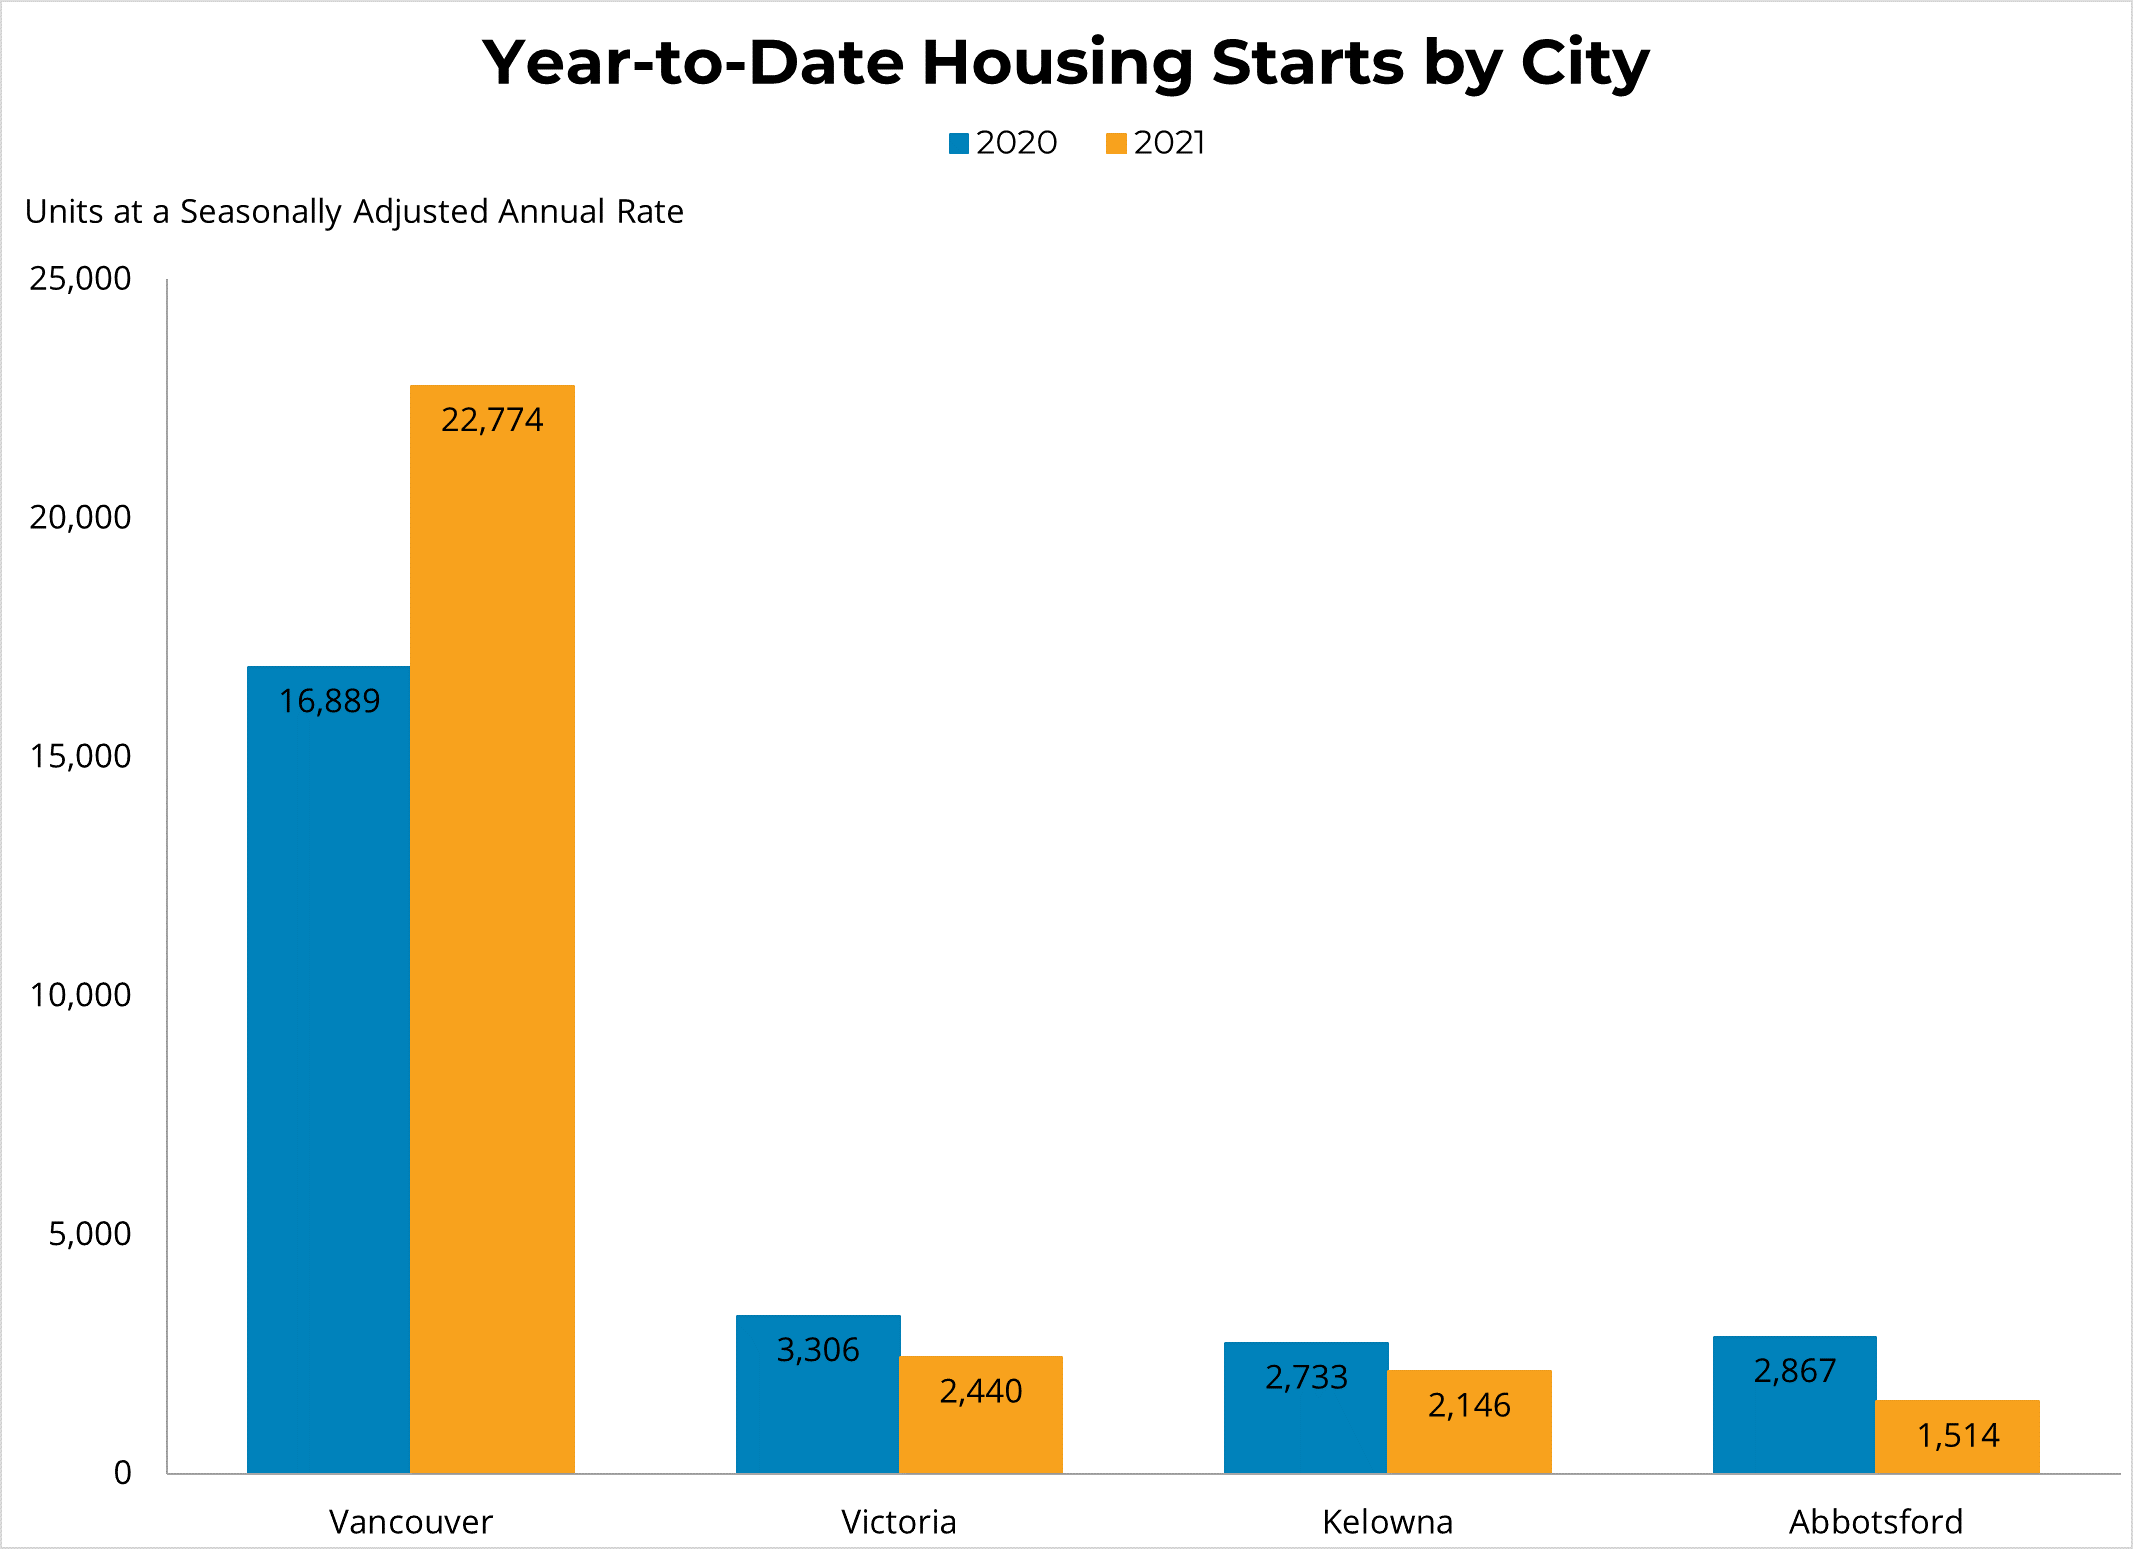
Canadian housing starts decreased by 13.5% m/m to 246k units in February at a seasonally adjusted annual rate (SAAR), following a strong increase of 24% in January. Housing starts decreased in all provinces except for BC. Building activity declined in both the multi-unit (-16%) and single-detached (-9%) segments. Despite February's decline, national housing starts were up by 17% compared to the same time last year. Also, the six-month moving average was still a strong 243k units SAAR.
In BC, housing starts increased by 21% m/m to 43.5k units SAAR in February, following a decrease of 17% in the previous month. Building activity was up by 39% in the multi-unit segment, while single-detached starts were down by 14%. The rise in the multi-unit segment was led by Vancouver, which reported a 70% increase in multi-unit starts in February. Compared to the same time last year, housing starts were up by 2% in BC.
The decline in February comes on the heels of a very strong 2020. Also, the level of residential construction activity is still above pre-pandemic levels, reflecting the high demand for housing that we've seen across the country. The value of BC residential building permits was down by 1% in January, led by the multi-unit segment, while permits were up for the single-detached segment.
Copyright British Columbia Real Estate Association. Reprinted with permission.
Posted on
March 13, 2021
by
Steve Flynn
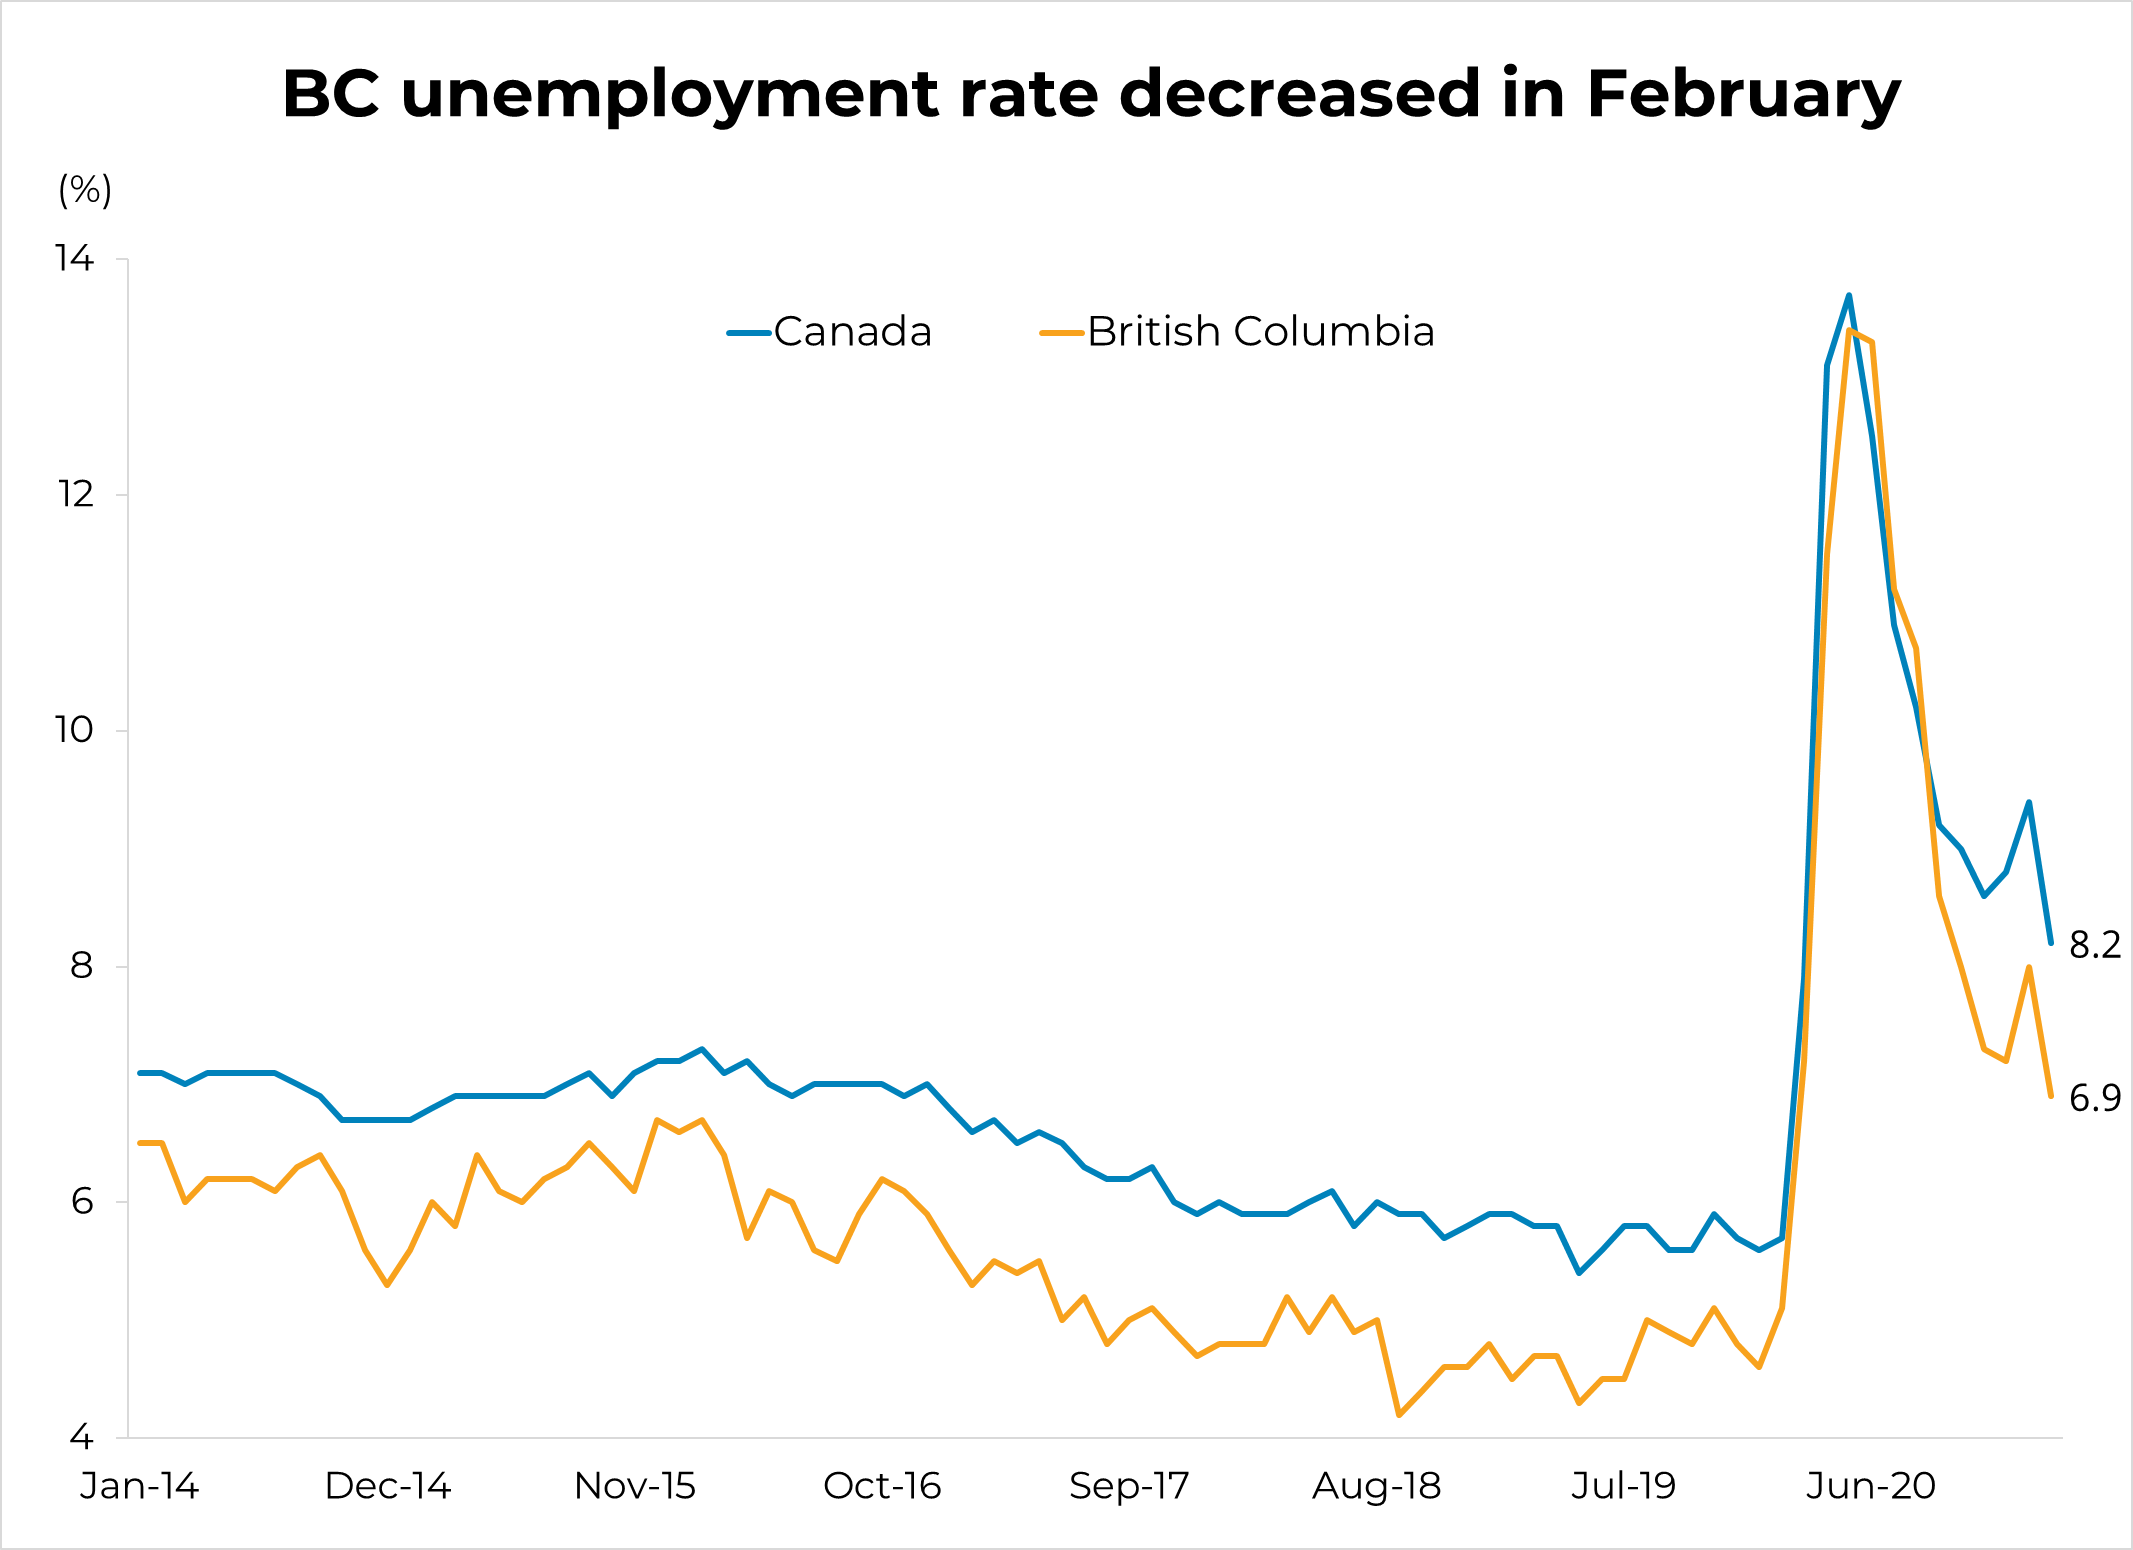
Canadian employment gained 259k jobs in February (1.4%, m/m), almost making up for the 266k jobs lost in the previous two months. This left the employment level 3.1% (-599k) below its February 2020 pre-pandemic level. The rise was largely in part-time employment with full-time positions continuing to see positive growth in February. Notable job gains were reported in Quebec (113k) and Ontario (100k), as both provinces began easing restrictions in February. The only province to report negative job growth was Newfoundland and Labrador. The national unemployment rate decreased by 1.2 percentage points to 8.2%, which is the lowest rate since March 2020.
In BC, employment grew by 27k (1.0%, m/m) in February, following a gain of 3k in January. The unemployment rate decreased from 8% to 6.9%, which is the lowest rate the province has recorded since February 2020. Meanwhile, in Vancouver, employment increased by 13.9k (1.0%,m/m), following a rise of 9.0k in the previous month. Compared to one year ago, employment in BC was down by 0.6% (-15K) jobs.
Although national employment is still 599k below its pre-pandemic level, February's employment gain is a step in the right direction. Today's bounce-back signals that the economy is gaining momentum, as the vaccine rollout enters its next phase and public health restrictions ease. That being said, progress could be thwarted if a third wave of the pandemic forces another round of restrictions.
Copyright British Columbia Real Estate Association. Reprinted with permission.
Posted on
March 11, 2021
by
Steve Flynn
The Bank of Canada maintained its overnight rate at 0.25 per cent this morning, a level it considers its effective lower bound. The Bank reiterated what it calls "extraordinary forward guidance" in committing to leaving the overnight rate at 0.25 per cent until slack in the economy is absorbed and inflation sustainably returns to its 2 per cent target. The Bank projects that will not occur until 2023.
The Bank is also continuing its quantitative easing (QE) program, purchasing at least $4 billion of Government of Canada bonds per week. In the statement accompanying the decision, the bank noted that while the near-term outlook for growth is strong, there remains considerable slack in the economy and employment is still well below its pre-COVID levels. Inflation is expected to move modestly higher, largely reflecting base-year effects and deep price declines in some goods and services at the start of the pandemic.
The Bank of Canada was anticipating a second wave induced contraction of the economy in the first quarter of this year and so finds itself somewhat caught off guard by a vastly improved economic outlook and rising long-term bond yields. The massive $1.9 trillion COVID-19 relief package, the American Rescue Plan, recently passed by the US Congress and good news on the speed of US vaccinations has prompted a re-set of expectations in financial markets as higher economic growth and inflation gets priced into bond yields.
While the Bank has continued its quantitative easing program aimed at holding Canadian long-term interest rates down, there is little it can do to combat the pressure on the Canadian yield curve from rising US long-term interest rates. Recognizing the much brighter economic outlook, the Bank may announce a tapering of its QE at its next meeting in April but will stick to its commitment to keep its policy rate on hold until 2023. That would mean a widening gap between fixed and variable mortgage rates over the next year as fixed mortgage rates rise alongside long-term interest rates.
Copyright British Columbia Real Estate Association. Reprinted with permission.
Posted on
March 9, 2021
by
Steve Flynn
Check out this informative Feb 2021 video:

Posted on
March 7, 2021
by
Steve Flynn
Vancouver, BC – March 12, 2021.
The British Columbia Real Estate Association (BCREA) reports that a total of 10,918 residential unit sales were recorded by the Multiple Listing Service® (MLS®) in February 2021, an increase of 89.1 per cent over February 2020 and over a thousand sales higher than the previous February record, set in 2016. The average MLS® residential price in BC was $889,584, a 17.3 per cent increase from $758,382 recorded in February 2020. Total sales dollar volume was $9.7 billion, a 121.8 per cent increase from last year.
“Near-record sales in Metro Vancouver, combined with unprecedented housing demand outside of Metro Vancouver, continues to drive a blistering pace of home sales in BC,” said BCREA Chief Economist Brendon Ogmundson.
Total active residential listings were down 28.7 per cent to 20,185 units in February, the lowest level of provincial active listings on record, going back to 2000. Fortunately, new listings have increased considerably, but given the pace of sales, total inventory of homes for sale remains severely depleted.
"There is a drought of resale inventory across the province,” added Ogmundson. "With so few listings, and with so much demand for single-detached homes, average prices have increased dramatically.”
Copyright British Columbia Real Estate Association. Reprinted with permission.
Posted on
March 3, 2021
by
Steve Flynn
The Canadian economy expanded at a 9.6 per cent annual rate in the fourth quarter of 2020. Growth was led by increased government spending, business investment and investment in new home construction and renovations as well as a large change in business inventories as large drawdowns of inventory from previous quarters reversed. For 2020 as a whole, the Canadian economy shrank 5.4 per cent, the steepest decline since quarterly GDP data were first recorded in 1961.
Interestingly, the households savings rate registered 12.7 per cent, the third consecutive quarter of double digit saving rate. Remarkably, total household savings in 2020 matched the cumulative savings of the previous seven years combined. That accumulated savings, and how it gets spent over the next year, will be a key component of what we expect to be a robust economic recovery in 2021.
Following an unprecedented 2020, we expect the Canadian economy will enjoy two years of very strong growth with the economy expanding by 5 per cent this year and a 4.3 per cent in 2022. An expected acceleration of vaccinations appears to be on the immediate horizon. As that roll-out progresses, we expect pent-up spending throughout the economy to be unleashed, driving a strong economic recovery.
While the Bank of Canada has not changed its commitment to keeping its overnight rate unchanged until 2023, there has been substantial upward pressure on long-term Canadian interest rates as markets price in a faster than expected recovery along with the impact of the $1.9 trillion US COVID-19 relief package. As 5-year government bond yields move higher, 5-year fixed mortgage rates have also started to rise from a record low average of 1.8 per cent to a still very low level of 1.95 per cent. For context, the average 5-year fixed rate prior to the onset of the COVID-19 pandemic was about 2.9 per cent.
Copyright British Columbia Real Estate Association. Reprinted with permission.
Posted on
March 2, 2021
by
Steve Flynn
Sales & prices were up for all home types in Feb 2021.
Copyright British Columbia Real Estate Association. Reprinted with permission.
Posted on
March 2, 2021
by
Steve Flynn
Competition amongst home buyers is putting upward pressure on home prices across Metro Vancouver’s* housing market:
The Real Estate Board of Greater Vancouver (REBGV) reports that residential home sales in the region totalled 3,727 in February 2021, a 73.3 per cent increase from the 2,150 sales recorded in February 2020, and a 56 per cent increase from the 2,389 homes sold in January 2021.
Last month’s sales were 42.8 per cent above the 10-year February sales average. “Metro Vancouver’s housing market is experiencing seller’s market conditions. The supply of listings for sale isn’t keeping up with the demand we’re seeing,” Colette Gerber, REBGV Chair said. “Competition amongst home buyers is causing multiple offer situations and upward pressure on prices.
“This is particularly true in the townhome market where demand is outstripping the available supply. Conditions differ depending on location and property type so it’s important to work with your local REALTOR® to develop strategies to meet your needs.”
There were 5,048 detached, attached and apartment homes newly listed for sale on the Multiple Listing Service® (MLS®) in Metro Vancouver in February 2021. This represents a 26.1 per cent increase compared to the 4,002 homes listed in February 2020 and a 12.7 per cent increase compared to January 2021 when 4,480 homes were listed.
The total number of homes currently listed for sale on the MLS® system in Metro Vancouver is 8,358, a 9.1 per cent decrease compared to February 2020 (9,195) and a 0.6 per cent increase compared to January 2021 (8,306). This is 21.2 per cent below the February 10-year average for new listings.
For all property types, the sales-to-active listings ratio for February 2021 is 44.6 per cent. By property type, the ratio is 41.8 per cent for detached homes, 61.8 per cent for townhomes, and 41.7 per cent for apartments. Generally, analysts say downward pressure on home prices occurs when the ratio dips below 12 per cent for a sustained period, while home prices often experience upward pressure when it surpasses 20 per cent over several months.
“Low interest rates remain a key driver in today’s market. We’re seeing steady numbers of first-time home buyers and move-up buyers entering the market,” Gerber said. The MLS® Home Price Index composite benchmark price for all residential properties in Metro Vancouver is currently $1,084,000. This represents a 6.8 per cent increase over February 2020 and a 2.6 per cent increase compared to January 2021.
Less populated communities within the region continue to experience the largest year-over-year price increases across all property types. Examples, according to the MLS HPI®. include Bowen Island (34.4 per cent increase), the Sunshine Coast (32.7 per cent increase), West Vancouver (16.1 per cent increase) Maple Ridge (14.8 per cent increase) and Ladner (13.7 per cent increase).
Sales of detached homes in Metro Vancouver reached 1,231 in February 2021, a 79.7 per cent increase from the 685 detached sales recorded in February 2020. The benchmark price for a detached home is $1,621,200. This represents a 13.7 per cent increase from February 2020 and a 2.8 per cent increase compared to January 2021.
Sales of apartment homes reached 1,759 in February 2021, a 65.8 per cent increase compared to the 1,061 sales in February 2020. The benchmark price of an apartment is $697,500. This represents a 2.5 per cent increase from February 2020 and a 2.5 per cent increase compared to January 2021.
Attached home sales in February 2021 totalled 737, an 82.4 per cent increase compared to the 404 sales in February 2020. The benchmark price of an attached home is $839,800. This represents a 7.2 per cent increase from February 2020 and a 2.9 per cent increase compared to January 2021.
* Areas covered by the Real Estate Board of Greater Vancouver include: Burnaby, Coquitlam, Maple Ridge, New Westminster, North Vancouver, Pitt Meadows, Port Coquitlam, Port Moody, Richmond, South Delta, Squamish, Sunshine Coast, Vancouver, West Vancouver, and Whistler.
Copyright British Columbia Real Estate Association. Reprinted with permission.
Categories:
Abbotsford West, Abbotsford Real Estate
|
Bolivar Heights, North Surrey Real Estate
|
Brentwood Park, Burnaby North Real Estate
|
Brighouse, Richmond Real Estate
|
Burnaby
|
Burnaby Real Estate
|
Burnaby South Real Estate
|
Cape Horn, Coquitlam Real Estate
|
Cariboo, Burnaby North Real Estate
|
Central BN, Burnaby North Real Estate
|
Central Coquitlam, Coquitlam
|
Central Coquitlam, Coquitlam Real Estate
|
Champlain Heights, Vancouver East
|
Champlain Heights, Vancouver East Real Estate
|
Cloverdale BC, Cloverdale Real Estate
|
Cloverdale BC, Surrey Real Estate
|
Cloverdale Real Estate
|
Coal Harbour, Vancouver West Real Estate
|
Coaquitlam
|
College Park PM, Port Moody Real Estate
|
Collingwood VE, Vancouver East Real Estate
|
Coquitlam
|
Coquitlam West, Coquitlam Real Estate
|
Downtown NW, New Westminster Real Estate
|
Downtown VW, Vancouver West
|
Downtown VW, Vancouver West Real Estate
|
Eagleridge, Coquitlam Real Estate
|
False Creek North, Vancouver West
|
Fraserview NW, New Westminster
|
Fraserview NW, New Westminster Real Estate
|
Fraserview VE, Vancouver East Real Estate
|
GlenBrooke North, New Westminster Real Estate
|
Grandview Surrey, Surrey Real Estate
|
Harrison Hot Springs Real Estate
|
Hastings, Vancouver East Real Estate
|
Highgate, Burnaby South Real Estate
|
Hockaday, Coquitlam Real Estate
|
January 2014 Sales in Greater Vancouver
|
Metrotown, Burnaby South Real Estate
|
New Horizons, Coquitlam Real Estate
|
New Westminster Real Estate
|
Port Moody
|
Port Moody Real Estate
|
Quay, New Westminster Real Estate
|
Queensborough, New Westminster Real Estate
|
Richmond Real Estate
|
Riverdale RI, Richmond Real Estate
|
Riverwood, Port Coquitlam Real Estate
|
Sapperton, New Westminster Real Estate
|
Simon Fraser Univer., Burnaby North Real Estate
|
Surrey
|
The Heights NW, New Westminster
|
The Heights NW, New Westminster Real Estate
|
Tsawwassen Central, Tsawwassen Real Estate
|
Uptown NW, New Westminster Real Estate
|
Uptown, New Westminster Real Estate
|
Vancouver
|
Vancouver East Real Estate
|
Videocast of January 2014 sales
|
Walnut Grove, Langley Real Estate
|
West Central, Maple Ridge Real Estate
|
West End VW, Vancouver West Real Estate
|
Whalley, North Surrey Real Estate
|
Whalley, Surrey Real Estate
|
Willoughby Heights, Langley Real Estate
|
 Subscribe with RSS Reader