Posted on
December 21, 2021
by
Steve Flynn
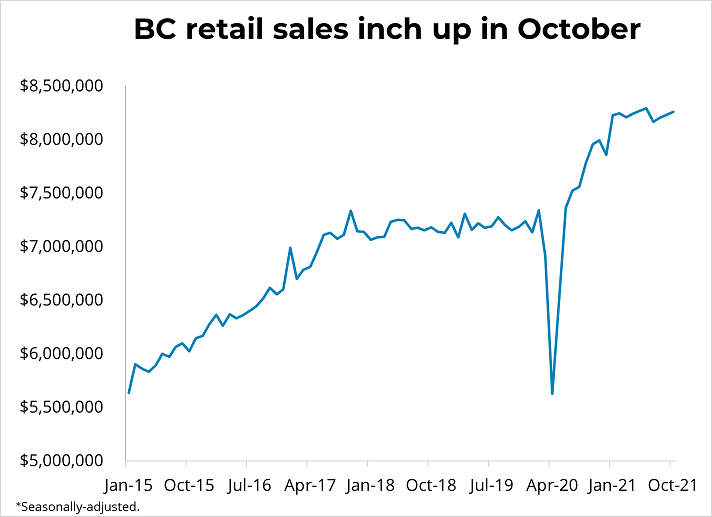
Canadian seasonally-adjusted retail sales rose 1.6% to $57.6 billion in October. The rise was driven by a rebound in sales at motor vehicle and parts dealers (+2.2%) as new car sales (+2.8%) recovered from previous declines. The effects of the semiconductor shortage which had curtailed sales of new cars eased somewhat in October. Preliminary estimates, based on roughly 40.9% of respondents reporting so far to Statistics Canada, indicate that retail sales rose 1.2% in November.
In BC, seasonally-adjusted sales rose 0.3% in October. Compared to the same month last year, retail sales were up 1.6% in the province. Clothing sales rose the largest amount on a year-over-year basis in October, up 13.3%. In the Greater Vancouver region, sales rose 1.5% month-over-month and were up 10.8% year-over-year.
In October, Canadian e-commerce sales rose from $3.2 billion to $3.3 billion. As a result, e-commerce increased from 5.4% of total retail sales in August to 5.5% in October. This percentage is lower than at most points since the onset of the pandemic but is elevated compared to pre-pandemic levels.
Copyright British Columbia Real Estate Association. Reprinted with permission.
Posted on
December 21, 2021
by
Steve Flynn
I have sold a property at 1701 SEMLIN DR in Vancouver. Beautifully renovated character house, situated on a corner lot in a prime area of Grandview. Top Commercial Drive location, smart layout with an excellent 3 bed plus den upper suite over 2 levels, and a 3 bed revenue suite w/ its own entrance and laundry. Fully renovated in 2014, plumbing, electrical, all bathrooms and kitchens, turn-key condition. Over height ceilings, top floor primary suite w/ en-suite, den, skylight. Mature gardens and patio spaces w/ excellent privacy. Walk everywhere, parks, schools, shops, services, all close by. Extraordinary value for a fully renovated house by the Drive. Currently tenanted with excellent rental income.
Posted on
December 20, 2021
by
Steve Flynn
Congrats to my Happy BUYER!
Posted on
December 17, 2021
by
Steve Flynn
Canadian prices, as measured by the Consumer Price Index (CPI), rose 4.7% on a year-over-year basis in November, matching the rate in October. On a month-over-month basis, the CPI was up 0.2% in November. The Bank of Canada's preferred measures of core inflation (which use techniques to strip out volatile elements) rose an average of 2.7% year-over-year in November. Higher prices for gasoline (+43.6%), furniture (+8.7%) and food (+4.4%) were the main drivers of growth in the headline CPI. Continuing supply-chain difficulties continued contributing to price gains, but the flooding in BC had no effect as data was collected prior to the floods in November. In BC, consumer prices were up 0.2% month-over-month, and up 3.3% on a year-over-year basis.
Inflation continues to run ahead of the Bank of Canada's 2 per cent target. The driving force behind rising prices in November year-over-year was a 10% increase in transportation costs due to rising gasoline prices. Inflation from shelter costs was up month-over-month as home prices trended higher after flattening out over the summer. Those categories account for about 65% of the year-over-year rise in consumer prices in November. We expect this elevated level of inflation to persist through next year before prices begin moderating. The Bank of Canada is clearly concerned about rising consumer prices and have signaled that it will begin raising its policy rate in the second or third quarter of 2022.
Copyright British Columbia Real Estate Association. Reprinted with permission.
Posted on
December 16, 2021
by
Steve Flynn
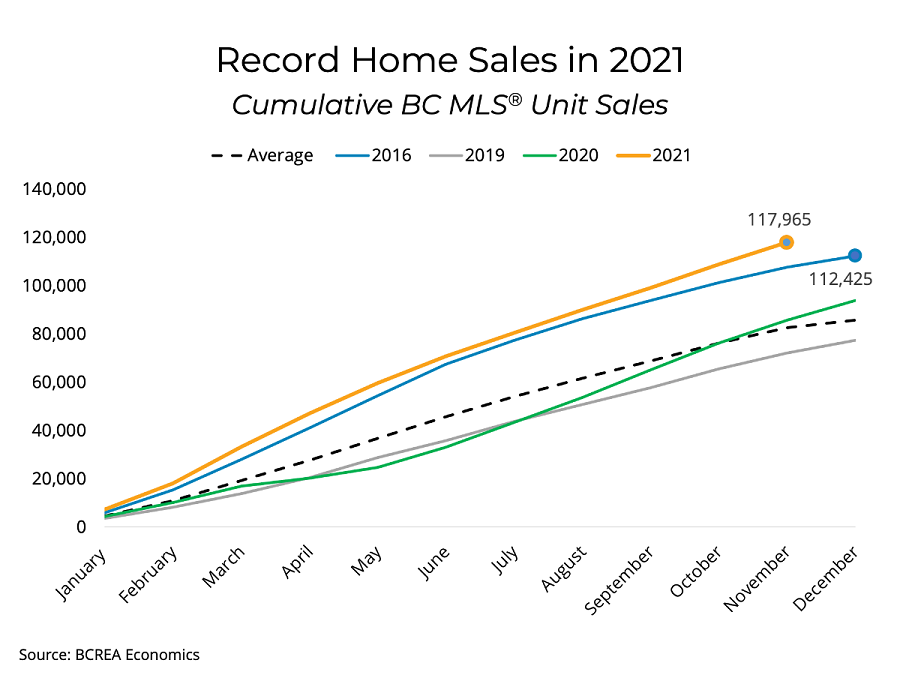
The British Columbia Real Estate Association (BCREA) reports that a total of 9,159 residential unit sales were recorded by the Multiple Listing Service® (MLS®) in November 2021, a decrease of 3.4 per cent from November 2020. The average MLS® residential price in BC was $993,922, a 22.1 per cent increase from $814,310 recorded in November 2020. Total sales dollar volume was $9.1 billion, a 17.9 per cent increase from the same time last year.
“Provincial MLS® home sales reached a new annual record in November with still one month to go in 2021,” said BCREA Chief Economist Brendon Ogmundson. “Home sales have already surpassed the previous annual record of 112,425 units set in 2016.”
Total active residential listings continued to tumbler lower, falling 39 per cent year-over-year to a record low for the province. Active listings are now about half of the level reached prior to the pandemic.
Year-to-date, BC residential sales dollar volume is up 63.6 per cent to $108.7 billion compared to the same period in 2020. Residential unit sales were up 37.7 per cent to 117,973 units, while the average MLS® residential price was up 18.8 per cent to $921,806.
Copyright British Columbia Real Estate Association. Reprinted with permission.
Posted on
December 15, 2021
by
Steve Flynn
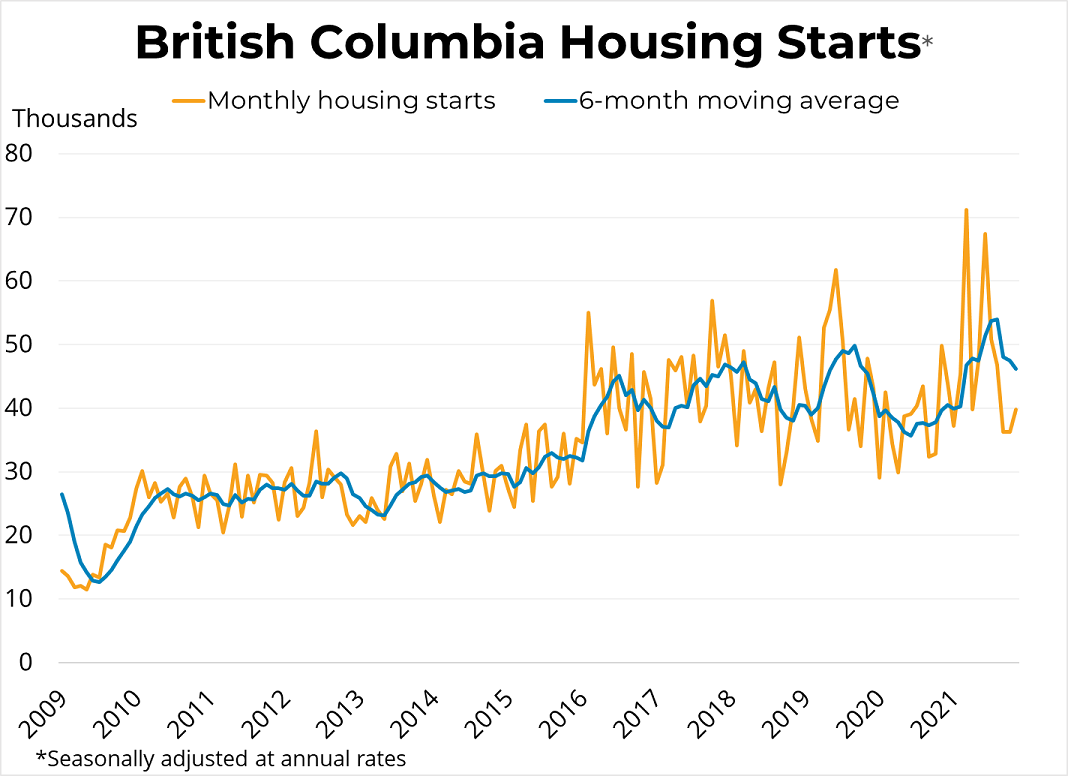
Canadian housing starts rose to 301.3k units in November, reversing 5 months of consecutive declines. Housing starts were up by 62.9k (26.4% m/m) in November at a seasonally-adjusted annual rate (SAAR). Comparing year-over-year, starts were up strongly from November of 2020 (15% y/y). Single-detached housing starts dipped 1% in November to 73.3k, while multi-family and others jumped 38.9% to 228k (SAAR).
In British Columbia, starts were up 9.8% in November, rising to 39.8k units SAAR in all areas of the province. In areas in the province with 10,000 or more residents, single-detached starts dropped 2.8% m/m to 7.2k units while multi-family starts offset this drop with a 13.7% rise to 28.5k units. Starts in the province were 20.1% below the levels from November 2020. Starts were down by 2.2k units in Vancouver but were offset by a 3.6k unit rise in Kelowna in November. The 6-month moving average trend declined 1.3k in November in BC.
Copyright British Columbia Real Estate Association. Reprinted with permission.
Posted on
December 8, 2021
by
Steve Flynn
The Bank of Canada maintained its overnight rate at 0.25 per cent this morning, a level it considers its effective lower bound. The Bank reiterated what it calls "extraordinary forward guidance" in committing to leaving the overnight rate at 0.25 per cent until slack in the economy is absorbed and inflation sustainably returns to its 2 per cent target. The Bank projects that will occur in the middle quarters of 2022. In the statement accompanying the decision, the Bank noted that recent economic indicators signal considerable momentum to end 2021, but the Omicron COVID-19 variant has injected renewed uncertainty into the global economy and flooding in British Columbia could weigh on growth in the short-term by compounding supply chain issues and reducing demand for some services. The Bank still expects inflation to ease back to its 2 per cent target by the second half of next year.
We expect the Bank will raise its overnight rate two times next year, followed by quarterly increases in 2023, bringing the overnight rate back to its pre-pandemic level by the end of 2023. It is possible that the Bank may act earlier or more aggressively next year, however the realities and uncertainties of the pandemic are still very much a presence in the global economy, particularly with the emergence of new COVID-19 variant. Consequently, it would not be surprising if the Bank of Canada had to delay its current expected schedule of rate increases.
Copyright British Columbia Real Estate Association. Reprinted with permission.
Posted on
December 6, 2021
by
Steve Flynn
Canadian employment grew for the sixth consecutive month in November according to Statistics Canada, rising by 154,000 to 19.316 million (0.8%, m/m). Canadian employment had recovered to its pre-pandemic level in September and is now roughly 1% above that level. Since the prior survey period, public health measures were largely unchanged except for some capacity limits and distancing requirements being further eased in Ontario and Quebec.
Employment gains in November were quite widely distributed across sectors of the economy. Employment increased in both the services-producing sector (+127,000) and the goods-producing sector (+26,000), while the employment rate for women aged 25 to 54 hit the highest rate ever recorded at 80.7%. The Canadian unemployment rate declined for a sixth consecutive month to 6.0%, the lowest level since the onset of the pandemic. The unemployment rate is now within 0.3% of the rate in February of 2020 (5.7%).
In BC, employment grew by 4,600 to 2.697 million (0.17%, m/m), once again hitting the highest level since the pandemic began. The unemployment rate was flat in November, remaining at 5.6%, the lowest level since the pandemic began. Only Manitoba has a lower unemployment rate in Canada, while Quebec is tied with BC for the second-lowest rate.
Copyright British Columbia Real Estate Association. Reprinted with permission.
Posted on
December 4, 2021
by
Steve Flynn
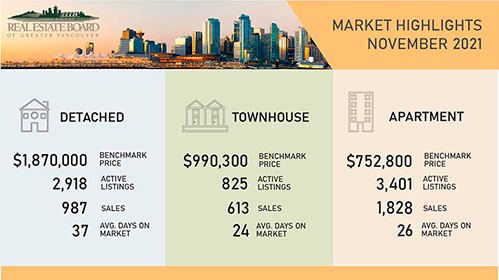
The MLS® Home Price Index composite benchmark price for all residential properties in Metro Vancouver* is currently $1,211,200. This represents a 16% increase from November 2020 and 1% increase compared to October 2021.
Specifically:
- The benchmark price for detached homes increased 1.1% from Oct 2021 and increasd 20.8% from Nov 2020.
- The benchmark price for townhouses increased 1.6% from Oct 2021 and increased 20.2% from Nov 2020.
- The benchmark price for apartment/condos increased 0.9% from Oct 2021 and increased 11.4% from Nov 2020.
* Areas covered by the Real Estate Board of Greater Vancouver include: Burnaby, Coquitlam, Maple Ridge, New Westminster, North Vancouver, Pitt Meadows, Port Coquitlam, Port Moody, Richmond, South Delta, Squamish, Sunshine Coast, Vancouver, West Vancouver, and Whistler.
Copyright British Columbia Real Estate Association. Reprinted with permission.
Posted on
December 3, 2021
by
Steve Flynn
As we near the end of 2021, home buyer demand remains well in excess of long-term averages and the supply of homes for sale continues to decline across Metro Vancouver’s* housing market:
The Real Estate Board of Greater Vancouver (REBGV) reports that residential home sales in the region totalled 3,428 in November 2021, an 11.9 per cent increase from the 3,064 sales recorded in November 2020, and a 1.9 per cent decrease from the 3,494 homes sold in October 2021. Last month’s sales were 33.6 per cent above the 10-year November sales average.
“We expect home sale totals to end the year at or near an all-time record in our region,” Keith Stewart, REBGV economist said. “We’ve had elevated home sale activity throughout 2021 despite persistently low levels of homes available for sale. With a new year around the corner, it’s critical that this supply crunch remains the focus for addressing the housing affordability challenges in our region.”
There were 3,964 detached, attached and apartment properties newly listed for sale on the Multiple Listing Service® (MLS®) in Metro Vancouver in November 2021. This represents a 2.6 per cent decrease compared to the 4,068 homes listed in November 2020 and a 2.1 per cent decrease compared to October 2021 when 4,049 homes were listed. The total number of homes currently listed for sale on the MLS® system in Metro Vancouver is 7,144, a 35.7 per cent decrease compared to November 2020 (11,118) and a 11.1 per cent decrease compared to October 2021 (8,034).
For all property types, the sales-to-active listings ratio for November 2021 is 48 per cent. By property type, the ratio is 33.8 per cent for detached homes, 74.3 per cent for townhomes, and 53.7 per cent for apartments. Generally, analysts say downward pressure on home prices occurs when the ratio dips below 12 per cent for a sustained period, while home prices often experience upward pressure when it surpasses 20 per cent over several months.
“The imbalance between supply and demand, coupled with some buyers wanting to use rate holds on lower rate fixed-term mortgages, is keeping upward pressure on home prices in this traditionally quieter time of year for the market,” Stewart said.
The MLS® Home Price Index composite benchmark price for all residential properties in Metro Vancouver is currently $1,211,200. This represents a 16 per cent increase over November 2020 and a one per cent increase compared to October 2021.
* Areas covered by the Real Estate Board of Greater Vancouver include: Burnaby, Coquitlam, Maple Ridge, New Westminster, North Vancouver, Pitt Meadows, Port Coquitlam, Port Moody, Richmond, South Delta, Squamish, Sunshine Coast, Vancouver, West Vancouver, and Whistler.
Copyright British Columbia Real Estate Association. Reprinted with permission.
Categories:
Abbotsford West, Abbotsford Real Estate
|
Bolivar Heights, North Surrey Real Estate
|
Brentwood Park, Burnaby North Real Estate
|
Brighouse, Richmond Real Estate
|
Burnaby
|
Burnaby Real Estate
|
Burnaby South Real Estate
|
Cape Horn, Coquitlam Real Estate
|
Cariboo, Burnaby North Real Estate
|
Central BN, Burnaby North Real Estate
|
Central Coquitlam, Coquitlam
|
Central Coquitlam, Coquitlam Real Estate
|
Champlain Heights, Vancouver East
|
Champlain Heights, Vancouver East Real Estate
|
Cloverdale BC, Cloverdale Real Estate
|
Cloverdale BC, Surrey Real Estate
|
Cloverdale Real Estate
|
Coal Harbour, Vancouver West Real Estate
|
Coaquitlam
|
College Park PM, Port Moody Real Estate
|
Collingwood VE, Vancouver East Real Estate
|
Coquitlam
|
Coquitlam West, Coquitlam Real Estate
|
Downtown NW, New Westminster Real Estate
|
Downtown VW, Vancouver West
|
Downtown VW, Vancouver West Real Estate
|
Eagleridge, Coquitlam Real Estate
|
False Creek North, Vancouver West
|
Fraserview NW, New Westminster
|
Fraserview NW, New Westminster Real Estate
|
Fraserview VE, Vancouver East Real Estate
|
GlenBrooke North, New Westminster Real Estate
|
Grandview Surrey, Surrey Real Estate
|
Harrison Hot Springs Real Estate
|
Hastings, Vancouver East Real Estate
|
Highgate, Burnaby South Real Estate
|
Hockaday, Coquitlam Real Estate
|
January 2014 Sales in Greater Vancouver
|
Metrotown, Burnaby South Real Estate
|
New Horizons, Coquitlam Real Estate
|
New Westminster Real Estate
|
Port Moody
|
Port Moody Real Estate
|
Quay, New Westminster Real Estate
|
Queensborough, New Westminster Real Estate
|
Richmond Real Estate
|
Riverdale RI, Richmond Real Estate
|
Riverwood, Port Coquitlam Real Estate
|
Sapperton, New Westminster Real Estate
|
Simon Fraser Univer., Burnaby North Real Estate
|
Surrey
|
The Heights NW, New Westminster
|
The Heights NW, New Westminster Real Estate
|
Tsawwassen Central, Tsawwassen Real Estate
|
Uptown NW, New Westminster Real Estate
|
Uptown, New Westminster Real Estate
|
Vancouver
|
Vancouver East Real Estate
|
Videocast of January 2014 sales
|
Walnut Grove, Langley Real Estate
|
West Central, Maple Ridge Real Estate
|
West End VW, Vancouver West Real Estate
|
Whalley, North Surrey Real Estate
|
Whalley, Surrey Real Estate
|
Willoughby Heights, Langley Real Estate
|
 Subscribe with RSS Reader