Posted on
May 30, 2020
by
Steve Flynn
The Canadian economy contracted 8.2 per cent at a quarterly annualized rate in the first quarter, including a 7.2 per cent decline in March following the paralysis of economic activity brought on by the COVID-19 pandemic. Household spending fell 2.3 per cent, the steepest drop ever recorded, while exports were down 3 per cent and government spending fell 1 per cent due to school closures and government curtailments. Total housing investment was down 0.1 per cent, with both renovation spending and ownership transfer costs falling. New home construction, however, rose 1.6 per cent.
As dramatic as the first quarter decline appears, it will almost certainly be overshadowed by the potential for a 30 per cent or more annualized decline in the second quarter, when the impact of COVID-19 on the economy is expected to be the most severe. Note that those are annualized estimates. The actual peak-to-trough decline in Canadian real GDP is estimated at 10-15 per cent before things begin to normalize and growth rebounds in the third and fourth quarter of this year.
Copyright British Columbia Real Estate Association. Reprinted with permission.
Posted on
May 22, 2020
by
Steve Flynn
Seasonally-adjusted Canadian retail sales fell by a whopping 10% in March to $47.1 billion. The largest drop since the data became available in 1991. About 40% of retailers closed their stores mid-month due to the pandemic, while in the clothing sub-sector 91% closed. Sales were down in 6 of 11 sub-sectors, representing 39% of retail sales. Leading the drop were clothing stores (-51%), auto dealers (-36%), and gas stations (-20%). In contrast, sales were up at grocery stores (23%), health and personal care stores (5%), and general merchandise stores (6%).
The shutdown of physical stores caused many retailers to shift or expand their online presence. E-commerce sales were up by 40% in March year-over-year at $2.2 billion, accounting for almost 5% of total retail sales. This excludes Canadians purchasing from foreign e-commerce retailers.
Sales were down in all provinces, leading the decline were Ontario (-9%), Quebec (-16%), and Alberta (-13%). In BC, seasonally-adjusted retail sales were down by 4.6% at $7 billion in March. Looking at the non-seasonally adjusted change shows a different picture. Retail sales in March were up by 5.3% from the previous month, notably at grocery stores (31%), building and garden material stores (26%), and at electronics and appliance stores (23%). Compared to the same time last year, BC retail sales were down by 3%.
Given that retailers were closed only starting mid-March, it is expected that the April decline will be higher. Advance estimates provided by Statistics Canada for April indicates retail sales declined by 15.6%. As some provinces begin to re-open, we can expect retail sales to gradually return, but the magnitude will largely depend on consumer demand, which has been cautious in other countries that have started to re-open. Moreover, unemployed individuals and individuals who have had their working hours reduced will likely not be making non-essential purchases in the near future.
Copyright British Columbia Real Estate Association. Reprinted with permission.
Posted on
May 20, 2020
by
Steve Flynn
Canadian inflation, as measured by the Consumer Price Index (CPI) fell by 0.2 per cent in April year-over-year, down from a 0.9 per cent gain in the previous month. This was the first year-over-year decline in the CPI since September 2009. Energy prices were the main drag on inflation due to the drop in global demand, excluding this category, national CPI rose by 1.6 per cent year-over-year. Prices were also down for transportation (-4.4%), clothing and footwear (-4.1%) and recreation and education (-0.7%). In contrast, prices (3.4%) for food accelerated in April. The Bank of Canada's three measures of trend inflation fell 0.1 percentage points, averaging 1.8 per cent in April. The CPI was negative in all provinces except for Quebec and BC.
In BC, CPI was flat in April year-over-year, following a 1.2 per cent increase in March. Gas prices continued to fall (-19.6%), along with prices for clothing and footwear (-7.4%), transportation (-2.4%), and goods (-2.2%). Clothing and footwear retailers had to drop their prices to clear inventory, but were restricted to online sales which meant fewer sales. Meanwhile, prices grew for health and personal care (0.9%), household furnishings (0.4%) and alcohol/tobacco/cannabis (0.3%). As BC begins to re-open retail stores and food service establishments, we hope April will represent a floor on price declines.
Copyright British Columbia Real Estate Association. Reprinted with permission.
Posted on
May 14, 2020
by
Steve Flynn
The British Columbia Real Estate Association (BCREA) reports that a total of 3,284 residential unit sales were recorded by the Multiple Listing Service® (MLS®) in April 2020, a decline of 50.8 per cent from April 2019. The average MLS® residential price in BC was $737,834, a 7.8 per cent increase from $684,430 recorded the previous year. Total sales dollar volume in March was $2.4 billion, a 46.9 per cent decrease over 2019.
"We expected to see a sharp drop in sales for April as we confronted the COVID-19 pandemic,” said BCREA Chief Economist Brendon Ogmundson. “However, buyers and sellers are adapting to a new normal, and activity should pick up as the economy gradually re-opens.”
While home sales were down by more than half compared to this time last year, the supply of homes for sale, which normally rises through the spring, was down close to 10 per cent on a seasonally adjusted basis and down 23.7 per cent year-over-year. That slide in total active listings means that prices remained firm despite the sharp fall in sales.
Year-to-date, BC residential sales dollar volume was up 9.6 per cent to $15.3 billion, compared with the same period in 2019. Residential unit sales were down 1.7 per cent to 20,164 units, while the average MLS® residential price was up 11.6 per cent to $758,614.
Copyright British Columbia Real Estate Association. Reprinted with permission.
Posted on
May 13, 2020
by
Steve Flynn
Check out this very informative video on April 2020's MLS market:

Posted on
May 9, 2020
by
Steve Flynn
Canadian employment fell further in April by 2 million jobs (-11%, m/m), bringing cumulative losses to 3 million since February. The unemployment rate rose by 5.3 percentage points from 7.8% to 13%, as the impact from the closure of non-essential businesses and travel restrictions were not fully reflected in last month's job report. The last recession to come close to this was 1981/82 when the peak unemployment rate was 13.1%. The unemployment rate would have been 17.8% in April if adjusted to include those wanting to work (and had worked recently), but were unable to because of the pandemic.
Job losses continued to spread across the country, with the largest declines in Ontario (-690k), Quebec (-560k), BC (-264k) and Alberta (-240k). The decline in employment was driven by the private sector (-1.87 million), while the public sector reported a smaller decline of -76.8k and self-employed were down by -43.1k. The most impacted industries continue to be in the service-sector, led by wholesale and retail trade (-14%) and accommodation and food services (-34.3%). The impact also spilled over to the goods-producing sector in April, led by declines in construction (-314K) and manufacturing (-267k), partially due to the closure of all construction sites in Quebec at the end of March. Compared to the same month last year, Canadian employment was down by -15% (-2.8 million).
Meanwhile, employment in BC fell by 264,000 jobs (-11%, m/m) in April, increasing the provincial unemployment rate by 4.3 percentage points from 7.2% to 11.5%. Three-quarters of the decline was in full-time work. Employment was down in all industries except for utilities. Compared to one year ago, employment in BC was down by 16.4% (-421k) jobs.
As restrictions around the pandemic are gradually eased in many provinces, we can expect some people to start returning to work, or have their hours worked increase. The magnitude and timing will largely depend on businesses and employees' willingness to return to work given ongoing health concerns. In April, there were about 3.8 million people who had some type of attachment to a specific job but were not working due to the pandemic, suggesting that they could return to the same job in the coming months.
Copyright British Columbia Real Estate Association. Reprinted with permission.
Posted on
May 6, 2020
by
Steve Flynn
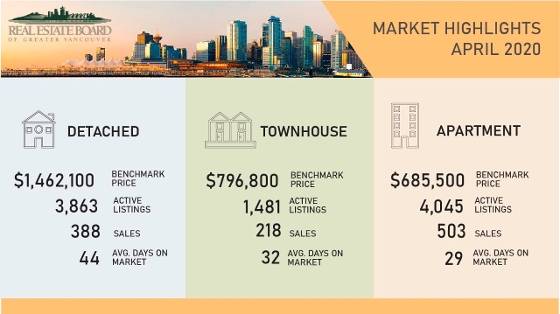
A quick snapshot of April's 2020 MLS Sales:
Copyright British Columbia Real Estate Association. Reprinted with permission.
Posted on
May 4, 2020
by
Steve Flynn
The Real Estate Board of Greater Vancouver (REBGV) reports that residential home sales in the region* totalled 1,109 in April 2020, a 39.4 per cent decrease from the 1,829 sales recorded in April 2019, and a 56.1 per cent decrease from the 2,524 homes sold in March 2020. Last month’s sales were 62.7 per cent below the 10-year April sales average and was the lowest total for the month since 1982.
“Predictably, the number of home sales and listings declined in April given the physical distancing measures in place,” Colette Gerber, REBGV’s president-elect said. “People are, however, adapting. They’re working with their Realtors to get information, advice and to explore their options so that they’re best positioned in the market during and after this pandemic.”
Realtors have been named an essential service by the provincial government to help the home buying and selling community meet their housing needs during the pandemic. “We’re seeing more innovation in today’s market, with Realtors using different technology to showcase homes virtually, assess neighbourhood amenities with their clients and handle paperwork electronically,” Gerber said.
There were 2,313 detached, attached and apartment properties newly listed for sale on the Multiple Listing Service® (MLS®) in Metro Vancouver in April. This represents a 59.7 per cent decrease compared to the 5,742 homes listed in April 2019 and a 47.9 per cent decrease compared to March 2020 when 4,436 homes were listed. The total number of homes currently listed for sale on the MLS® system in Metro Vancouver is 9,389, a 34.6 per cent decrease compared to April 2019 (14,357) and a 2.3 per cent decrease compared to March 2020 (9,606).
For all property types, the sales-to-active listings ratio for April 2020 is 11.8 per cent. By property type, the ratio is 10 per cent for detached homes, 14.7 per cent for townhomes, and 12.4 per cent for apartments. Generally, analysts say downward pressure on home prices occurs when the ratio dips below 12 per cent for a sustained period, while home prices often experience upward pressure when it surpasses 20 per cent over several months.
The MLS® Home Price Index composite benchmark price for all residential properties in Metro Vancouver is currently $1,036,000. This represents a 2.5 per cent increase over April 2019 and a 0.2 per cent increase compared to March 2020. “Home prices have held relatively steady in our region since the COVID-19 situation worsened in March,” Gerber said.
Sales of detached homes in April 2020 reached 388, a 33.8 per cent decrease from the 586 detached sales recorded in April 2019. The benchmark price for detached properties is $1,462,100. This represents a 2.3 per cent increase from April 2019 and a 0.8 per cent increase compared to March 2020.
Sales of apartment homes reached 503 in April 2020, a 43.2 per cent decrease compared to the 885 sales in April 2019. The benchmark price of an apartment property is $685,500. This represents a 2.7 per cent increase from April 2019 and a 0.2 per cent decrease compared to March 2020.
Attached home sales in April 2020 totalled 218, a 39.1 per cent decrease compared to the 358 sales in April 2019. The benchmark price of an attached home is $796,800. This represents a 2.8 per cent increase from April 2019 and a 0.6 per cent increase compared to March 2020.
* Areas covered by the Real Estate Board of Greater Vancouver include: Burnaby, Coquitlam, Maple Ridge, New Westminster, North Vancouver, Pitt Meadows, Port Coquitlam, Port Moody, Richmond, South Delta, Squamish, Sunshine Coast, Vancouver, West Vancouver, and Whistler.
Copyright British Columbia Real Estate Association. Reprinted with permission.
Categories:
Abbotsford West, Abbotsford Real Estate
|
Bolivar Heights, North Surrey Real Estate
|
Brentwood Park, Burnaby North Real Estate
|
Brighouse, Richmond Real Estate
|
Burnaby
|
Burnaby Real Estate
|
Burnaby South Real Estate
|
Cape Horn, Coquitlam Real Estate
|
Cariboo, Burnaby North Real Estate
|
Central BN, Burnaby North Real Estate
|
Central Coquitlam, Coquitlam
|
Central Coquitlam, Coquitlam Real Estate
|
Champlain Heights, Vancouver East
|
Champlain Heights, Vancouver East Real Estate
|
Cloverdale BC, Cloverdale Real Estate
|
Cloverdale BC, Surrey Real Estate
|
Cloverdale Real Estate
|
Coal Harbour, Vancouver West Real Estate
|
Coaquitlam
|
College Park PM, Port Moody Real Estate
|
Collingwood VE, Vancouver East Real Estate
|
Coquitlam
|
Coquitlam West, Coquitlam Real Estate
|
Downtown NW, New Westminster Real Estate
|
Downtown VW, Vancouver West
|
Downtown VW, Vancouver West Real Estate
|
Eagleridge, Coquitlam Real Estate
|
False Creek North, Vancouver West
|
Fraserview NW, New Westminster
|
Fraserview NW, New Westminster Real Estate
|
Fraserview VE, Vancouver East Real Estate
|
GlenBrooke North, New Westminster Real Estate
|
Grandview Surrey, Surrey Real Estate
|
Harrison Hot Springs Real Estate
|
Hastings, Vancouver East Real Estate
|
Highgate, Burnaby South Real Estate
|
Hockaday, Coquitlam Real Estate
|
January 2014 Sales in Greater Vancouver
|
Metrotown, Burnaby South Real Estate
|
New Horizons, Coquitlam Real Estate
|
New Westminster Real Estate
|
Port Moody
|
Port Moody Real Estate
|
Quay, New Westminster Real Estate
|
Queensborough, New Westminster Real Estate
|
Richmond Real Estate
|
Riverdale RI, Richmond Real Estate
|
Riverwood, Port Coquitlam Real Estate
|
Sapperton, New Westminster Real Estate
|
Simon Fraser Univer., Burnaby North Real Estate
|
Surrey
|
The Heights NW, New Westminster
|
The Heights NW, New Westminster Real Estate
|
Tsawwassen Central, Tsawwassen Real Estate
|
Uptown NW, New Westminster Real Estate
|
Uptown, New Westminster Real Estate
|
Vancouver
|
Vancouver East Real Estate
|
Videocast of January 2014 sales
|
Walnut Grove, Langley Real Estate
|
West Central, Maple Ridge Real Estate
|
West End VW, Vancouver West Real Estate
|
Whalley, North Surrey Real Estate
|
Whalley, Surrey Real Estate
|
Willoughby Heights, Langley Real Estate
|
 Subscribe with RSS Reader


