Posted on
May 29, 2021
by
Steve Flynn
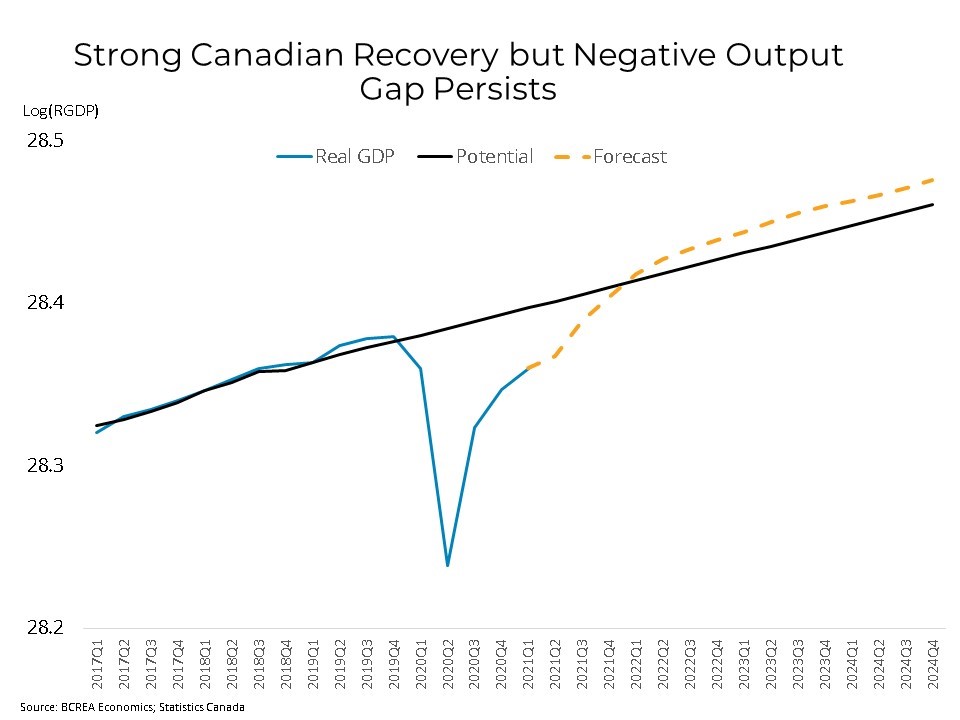
The Canadian economy expanded at a 5.6 per cent annual rate in the first quarter of 2021, including very strong growth in March. However, restrictions due to the third wave of the pandemic point to a minor contraction of output in the month of April before getting back on track for the rest of the year. Growth was led by a 9.4 per cent increase in housing investment, which led the overall recovery, rising 26.5 per cent since the first quarter of last year. Household spending was up 0.7 per cent in the first quarter or about 2.7 per cent on an annualized basis as household disposable income rose for the first time following two consecutive declines . Households continue to save at historically high rates during the pandemic. The national household savings rate rose to 13.1 per cent in the first quarter of 2021, more than double the savings rate this time last year. As vaccinations continue a strong ascent, we expect the Canadian economy to record about 6 per cent growth this year.
The Canadian economy is enjoying strong growth and that growth should continue through most of this year as ramped up vaccinations combine with pent-up demand and unprecedented household savings. While strong economic growth this year is a near certainty, what is less certain is the impact that growth may have on inflation and therefore the direction of the Bank of Canada. Most view the recent increase in inflation as a temporary phenomenon driven mainly by "base-year" and other transitory effects. While there is some risk that an over-stimulated economy may be more inflationary than currently believed, there remains considerable slack in the Canadian economy and financial markets remain unconvinced that the economy is headed for markedly higher inflation. That has left government bond yields and fixed mortgage rates low and stable for the past several months.
Copyright British Columbia Real Estate Association. Reprinted with permission.
Posted on
May 27, 2021
by
Steve Flynn
I have sold a property at 18 1141 Eagleridge DR in Coquitlam. Freshly updated and spacious 3 bed/2 bath end-unit backing onto greenbelt. Large, private and sunny backyard with new solid wooden deck. Many recent upgrades including updated kitchen, laminate flooring and paint. Newer appliances and brand new hot water tank. Carport parking, garden shed plus storage locker on the side. Attractive, friendly and well-maintained family complex. Recently painted exterior with new fencing and updated windows. Walk to everything from this quiet central location. Great place to raise a family or downsize and enjoy the privacy and amenities nearby. Tennis courts, park and outdoor pool right across the street. Shopping is only a few minute walk along creekside trails.
Posted on
May 24, 2021
by
Steve Flynn
Canadian retail sales increased 3.6% m/m on a seasonally-adjusted basis in March. Sales were higher in 10 of 11 sub-sectors, led by higher sales at garden equipment and building stores. Excluding more volatile sectors like motor-vehicles and gasoline sales , retail sales were up 4.7% in February. Statistics Canada also released a preliminary estimate for April showing retail sales declined 5.1% as enhanced "circuit-breaker" measures were implemented in many provinces to stem the third wave of COVID-19.
In BC, seasonally-adjusted retail sales were down 1.1% m/m as COVID-19 cases surged through the month of March. Retail sales fell 2% m/m in Metro Vancouver . On a non-seasonally adjusted basis, BC retail sales were up by 20% compared to the same time last year.
In March, Canadian e-commerce sales rose 58.5% year-over-year to $3.7 billion, accounting for 6.3% of total retail sales. The share of e-commerce was down 0.7 percentage points as more brick-and-mortar stores were open to in-person shopping.
Copyright British Columbia Real Estate Association. Reprinted with permission.
Posted on
May 20, 2021
by
Steve Flynn
I have listed a new property at 1104 6659 SOUTHOAKS CRES in Burnaby. FANTASTIC 1160 sq ft, 2 bed/2 bath+den+eating area in Bosa-built Gemini 2 in Highgate. Condo faces south on the quiet side of the building. All rooms are big & bright w/amazing VIEWS! Large, updated kitchen w/granite countertops & new s/s appliances. Gas fireplace in liv room + access to the expansive balcony. Master bedroom is big w/tons of closets. Both bedrooms open onto balcony. Eating area is perfect for future poker nights & the den makes a great home office. Amenities incl: gym, yoga room, steam room, sauna, meeting room & playground. Excellent building, very pro-active strata. Great location, 10 min walk to Edmonds Skytrain, Highgate Mall & 10 min drive to Metrotown. 2 parking, 1 locker, 2 pets alllowed, no rentals. 1st showings this Fri, 5-7pm. Offers anytime. Check VIRTUAL tour!
Posted on
May 18, 2021
by
Steve Flynn
Canadian housing starts decreased by 19.8% m/m to 268.6k units in April at a seasonally adjusted annual rate (SAAR), following a record setting March. Building activity declined in both the multi-unit (-24%) and single-detached (-9%) segments. National housing starts were up by 63% compared to the same time last year and the six-month moving average level of starts is trending at an elevated level of 279,000 units SAAR.
In BC, housing starts fell 47% m/m to 38.3k units SAAR after a record March that saw new home construction at a 70K unit annualized pace. Building activity was down 53% in the multi-unit segment, while single-detached starts were down by 10%. Compared to the same time last year, housing starts were up by 29% in BC.
Copyright British Columbia Real Estate Association. Reprinted with permission.
Posted on
May 11, 2021
by
Steve Flynn
Click on the image below to view our April 2021 market insights video:

Posted on
May 9, 2021
by
Steve Flynn
Vancouver, BC – May 13, 2021.
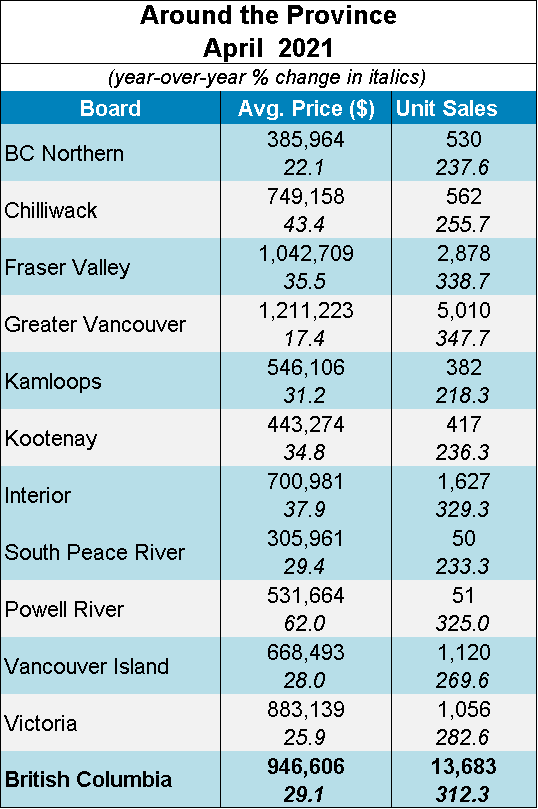
The British Columbia Real Estate Association (BCREA) reports that a total of 13,683 residential unit sales were recorded by the Multiple Listing Service® (MLS®) in April 2021, an increase of 312.3 per cent over April 2020 when the onset of the COVID-19 pandemic prompted a lockdown of the provincial economy. The average MLS® residential price in BC was $946,606, a 29.1 per cent increase from $733,330 recorded in April 2020. Total sales dollar volume was $12.9 billion, a 432.2 per cent increase from last year.
“Although provincial home sales were down slightly from an all-time high in March, sales activity was the highest on record for April,” said BCREA Chief Economist Brendon Ogmundson. “Home sales continue on a record pace, though we do see a calming environment compared to the frenzied activity of recent months.”
Total active residential listings were down 14.5 per cent year-over-year in April but did tick higher on a seasonally adjusted basis for the second consecutive month as new listings activity ramped up.
"We are starting to see very strong new listings activity in several markets,” said Ogmundson, “however, it will take quite some time for total listings to return to the level needed to balance out markets and temper growth in home prices.”
Copyright British Columbia Real Estate Association. Reprinted with permission.
Posted on
May 6, 2021
by
Steve Flynn
April 2021's sales were the highest total on record for any April.
Posted on
May 5, 2021
by
Steve Flynn
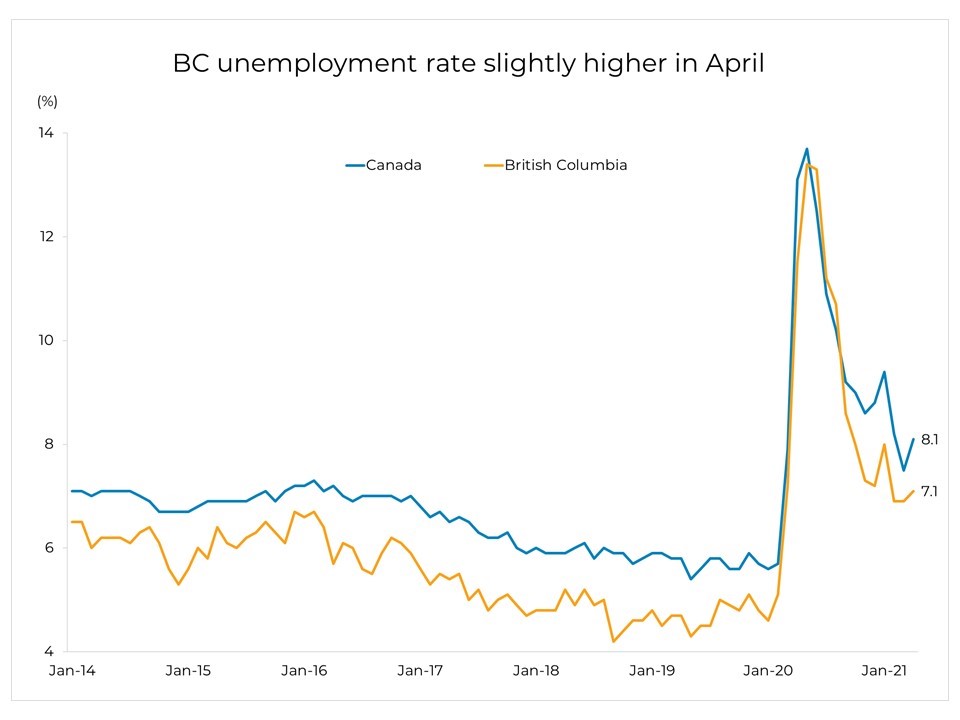
Canadian employment fell by 207,000 jobs in April (-1.1%, m/m), following a 303,000 gain in March. The level of Canadian employment is now 2.7% (-503k) below its February 2020 pre-pandemic level. The decline in April reflects the implementation of public health measures in Ontario, British Columbia and Quebec. The national unemployment rate increased percentage 0.6 points to 8.1%.
In BC, employment fell by 43,100 (-1.6%, m/m) in April following a gain of 35k in January. The provincial unemployment rate rose 0.2 points to 7.1%. The overwhelming majority of those job losses were in part-time work as restaurants closed for in-person dining and other "circuit breaker" restrictions took hold in the province. The decline in April was the first month of job losses since April 2020. Most of the job losses were in Vancouver where employment fell by 26,000 (-1.7%,m/m) in April.
Copyright British Columbia Real Estate Association. Reprinted with permission.
Posted on
May 5, 2021
by
Steve Flynn
Supply response emerges in Metro Vancouver’s* active housing market:
Home sellers have become increasingly active in Metro Vancouver’s housing market this spring in response to heightened demand and rising home values that have materialized during the pandemic.
The Real Estate Board of Greater Vancouver (REBGV) reports that residential home sales in the region totalled 4,908 in April 2021, a 342.6 per cent increase from the 1,109 sales recorded in April 2020, and a 14 per cent decrease from the 5,708 homes sold in March 2021.
Last month’s sales were 56.2 per cent above the 10-year April sales average and is the highest total on record for the month. "Our housing market has changed considerably from one year ago when COVID-19 concerns brought activity to a near standstill,” Keith Stewart, REBGV’s economist said. “This was followed by a well-documented spike in home buyer demand across the region. So far this spring, we’ve seen a corresponding supply response from home sellers."
There were 7,938 detached, attached and apartment homes newly listed for sale on the Multiple Listing Service® (MLS®) in Metro Vancouver in April 2021. This represents a 243.2 per cent increase compared to the 2,313 homes listed in April 2020, a 4.2 per cent decrease compared to March 2021 when 8,287 homes were listed and is the highest new listing total ever recorded in the region in April.
"While homes are now being listed at record levels, more supply is needed to meet today's demand and help market conditions achieve greater balance," Stewart said. The total number of homes currently listed for sale on the MLS® system in Metro Vancouver is 10,245, a 9.1 per cent increase compared to April 2020 (9,389) and a 12 per cent increase compared to March 2021 (9,145).
Today’s active listings total is 11.2 per cent below the 10-year April average. For all property types, the sales-to-active listings ratio for April 2021 is 47.9 per cent. By property type, the ratio is 37.4 per cent for detached homes, 70 per cent for townhomes, and 51.5 per cent for apartments.
Generally, analysts say downward pressure on home prices occurs when the ratio dips below 12 per cent for a sustained period, while home prices often experience upward pressure when it surpasses 20 per cent over several months.
“Record low interest rates, increased household savings, a strengthening economy and a continued focus on living space during the pandemic are all factors that are helping to bolster demand while steady price growth is encouraging more sellers to list their homes,” Stewart said.
The MLS® Home Price Index composite benchmark price for all residential properties in Metro Vancouver is currently $1,152,600. This represents a 12 per cent increase over April 2020 and a 2.6 per cent increase compared to March 2021.
"With our market at record activity in recent months, and with the continued safety risk that COVID-19 poses, REALTORS® remain focused on helping their clients make sound and responsible buying and selling decisions today while continuing to strictly follow the pandemic safety protocols established for real estate in our province," Taylor Biggar, REBGV Chair said.
Sales of detached homes in April 2021 reached 1,655, a 326.5 per cent increase from the 388 detached sales recorded in April 2020. The benchmark price for a detached home is $1,755,500. This represents a 20.9 per cent increase from last year and a 3.2 per cent increase compared to March 2021.
Sales of apartment homes reached 2,289 in April 2021, a 355.1 per cent increase compared to the 503 sales in April 2020. The benchmark price of an apartment home is $729,600. This represents a 5.9 per cent increase from April 2020 and a 1.9 per cent increase compared to March 2021.
Attached home sales in April 2021 totalled 964, a 342.2 per cent increase compared to the 218 sales in April 2020. The benchmark price of an attached home is $900,900. This represents a 13.9 per cent increase from April 2020 and a 3.3 per cent increase compared to March 2021.
* Areas covered by the Real Estate Board of Greater Vancouver include: Burnaby, Coquitlam, Maple Ridge, New Westminster, North Vancouver, Pitt Meadows, Port Coquitlam, Port Moody, Richmond, South Delta, Squamish, Sunshine Coast, Vancouver, West Vancouver, and Whistler.
Copyright British Columbia Real Estate Association. Reprinted with permission.
Posted on
May 1, 2021
by
Steve Flynn
Canadian real GDP grew by 0.4% in February, following a 0.7% increase in the previous month. This is the 10th consecutive monthly gain since the steepest drops in Canadian history was observed in March and April. This brings GDP 2% below the February pre-pandemic level of output.
Leading the increase the retail sector which jumped 4.5% after consecutive monthly declines prompted by provincial lockdown measures. Residential construction rose 4.7% while the GDP of offices of real estate agents and brokers was up 2.8%.
Early estimates from Statistics Canada indicate that real GDP grew by 0.9% in March. That puts first quarter Canadian GDP on track to grow about 6.5% on an quarterly annualized basis.
Copyright British Columbia Real Estate Association. Reprinted with permission.
Categories:
Abbotsford West, Abbotsford Real Estate
|
Bolivar Heights, North Surrey Real Estate
|
Brentwood Park, Burnaby North Real Estate
|
Brighouse, Richmond Real Estate
|
Burnaby
|
Burnaby Real Estate
|
Burnaby South Real Estate
|
Cape Horn, Coquitlam Real Estate
|
Cariboo, Burnaby North Real Estate
|
Central BN, Burnaby North Real Estate
|
Central Coquitlam, Coquitlam
|
Central Coquitlam, Coquitlam Real Estate
|
Champlain Heights, Vancouver East
|
Champlain Heights, Vancouver East Real Estate
|
Cloverdale BC, Cloverdale Real Estate
|
Cloverdale BC, Surrey Real Estate
|
Cloverdale Real Estate
|
Coal Harbour, Vancouver West Real Estate
|
Coaquitlam
|
College Park PM, Port Moody Real Estate
|
Collingwood VE, Vancouver East Real Estate
|
Coquitlam
|
Coquitlam West, Coquitlam Real Estate
|
Downtown NW, New Westminster Real Estate
|
Downtown VW, Vancouver West
|
Downtown VW, Vancouver West Real Estate
|
Eagleridge, Coquitlam Real Estate
|
False Creek North, Vancouver West
|
Fraserview NW, New Westminster
|
Fraserview NW, New Westminster Real Estate
|
Fraserview VE, Vancouver East Real Estate
|
GlenBrooke North, New Westminster Real Estate
|
Grandview Surrey, Surrey Real Estate
|
Harrison Hot Springs Real Estate
|
Hastings, Vancouver East Real Estate
|
Highgate, Burnaby South Real Estate
|
Hockaday, Coquitlam Real Estate
|
January 2014 Sales in Greater Vancouver
|
Metrotown, Burnaby South Real Estate
|
New Horizons, Coquitlam Real Estate
|
New Westminster Real Estate
|
Port Moody
|
Port Moody Real Estate
|
Quay, New Westminster Real Estate
|
Queensborough, New Westminster Real Estate
|
Richmond Real Estate
|
Riverdale RI, Richmond Real Estate
|
Riverwood, Port Coquitlam Real Estate
|
Sapperton, New Westminster Real Estate
|
Simon Fraser Univer., Burnaby North Real Estate
|
Surrey
|
The Heights NW, New Westminster
|
The Heights NW, New Westminster Real Estate
|
Tsawwassen Central, Tsawwassen Real Estate
|
Uptown NW, New Westminster Real Estate
|
Uptown, New Westminster Real Estate
|
Vancouver
|
Vancouver East Real Estate
|
Videocast of January 2014 sales
|
Walnut Grove, Langley Real Estate
|
West Central, Maple Ridge Real Estate
|
West End VW, Vancouver West Real Estate
|
Whalley, North Surrey Real Estate
|
Whalley, Surrey Real Estate
|
Willoughby Heights, Langley Real Estate
|
 Subscribe with RSS Reader