Posted on
June 23, 2022
by
Steve Flynn
Canadian prices, as measured by the Consumer Price Index (CPI), rose 7.7 per cent on a year-over-year basis in May, up from 6.8 per cent last month. This was the fastest growth rate since January 1983. According to Statistics Canada, price rises were broad-based, with groceries up 9.7 per cent year-over-year, gasoline up 48 per cent, and shelter costs up 7.4 per cent. Excluding gasoline, the CPI rose 6.3 per cent year over year in May. Month-over-month, on a seasonally-adjusted basis, prices were up 1.1 per cent, the fastest pace since the introduction of the series in 1992. In BC, consumer prices rose 8.1 per cent year-over-year. Average hourly wages grew 3.9 per cent year-over-year in May, indicating a decline in purchasing power.
A steep trajectory for the overnight rate implies that the 5-year fixed mortgage rate could reach the 5 per cent level for the first time since 2009 while variable mortgage rates may rise to as high as 4.5 per cent. With the stress test for both insured and uninsured borrowers, prospective homebuyers are currently being qualified at a rate of 6.49 per cent with a strong possibility of qualifying at 7 per cent soon, a rate that has not been a reality in the Canadian mortgage market since the early 2000s.
Given how aggressive markets expect the Bank of Canada to be, any good news on inflation, or any significant deterioration in the Canadian economy, could see a significant reversal in the most recent jump in Canadian bond yields. However, the baseline case for now is a Bank of Canada that is single-minded in its pursuit of lower inflation.
Copyright British Columbia Real Estate Association. Reprinted with permission.
Posted on
June 18, 2022
by
Steve Flynn
Vancouver, BC – June 17, 2022.
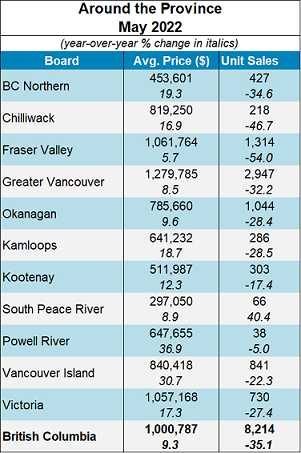
The British Columbia Real Estate Association (BCREA) reports that a total of 8,214 residential unit sales were recorded by the Multiple Listing Service® (MLS®) in May 2022, a decrease of 35.1 per cent from May 2021. The average MLS® residential price in BC was $1 million, a 9.3 per cent increase from $915,392 recorded in May 2021. Total sales dollar volume was $8.2 billion, a 29.1 per cent decline from the same time last year.
“Canadian mortgage rates continue to climb,” said BCREA Chief Economist Brendon Ogmundson. “The average 5-year fixed mortgage rate reached 4.49 per cent in June. That is the highest mortgage rates have been since 2009.”
Provincial active listings were 4.4 per cent higher than this time last year, the first year-over-year increase in active listings since 2019. However, active listings still remain below what is typical for a balanced market, though current market conditions have a high degree of variation across regions and product types.
Year-to-date, BC residential sales dollar volume was down 14.5 per cent to $46.7 billion, compared with the same period in 2021. Residential unit sales were down 26.3 per cent to 43,921 units, while the average MLS® residential price was up 16 per cent to $1.06 million.
Copyright British Columbia Real Estate Association. Reprinted with permission.
Posted on
June 11, 2022
by
Steve Flynn
Canadian employment edged up by 39,800 to 19.64 million in May. The labour market continued to tighten, with the Canadian unemployment rate declining by 0.1 to 5.1 per cent, the lowest rate on record for a second consecutive month. Average hourly wages were up 3.9 per cent on a year-over-year basis, increasing from April's 3.3 per cent. Wage gains are below the inflation rate, however, which hit 6.8 per cent year-over-year in the most-recent data. The employment rate held steady at 61.9 per cent.
Employment in BC grew by 5.1k to 2.74 million in May. Metro Vancouver's employment grew by 7.1k (0.5 per cent) month over month. The unemployment rate declined sharply in May to 4.5 per cent, approaching record lows set in the mid 2000s. Of the provinces, only Quebec currently has a lower unemployment rate.
Copyright British Columbia Real Estate Association. Reprinted with permission.
Posted on
June 4, 2022
by
Steve Flynn
The MLS® Home Price Index composite benchmark price for all residential properties in Metro Vancouver* is currently $1,370,377. This represents a 0.3% decrease from Apr 2022 and a 14.7% increase from May 2021.
Specifically:
- The benchmark price for detached homes decreased 0.4% from Apr 2022 and increased 15% from May 2021.
- The benchmark price for townhouses decreased 0.6% from Apr 2022 and increased 21.5% from May 2021.
- The benchmark price for apartment/condos increased 0.4% from Apr 2022 and increased 15% from May 2021.
* Areas covered by the Real Estate Board of Greater Vancouver include: Burnaby, Coquitlam, Maple Ridge, New Westminster, North Vancouver, Pitt Meadows, Port Coquitlam, Port Moody, Richmond, South Delta, Squamish, Sunshine Coast, Vancouver, West Vancouver, and Whistler.
Copyright British Columbia Real Estate Association. Reprinted with permission
Posted on
June 3, 2022
by
Steve Flynn
After reaching record-setting levels in 2021, home sale activity has returned to more typical seasonal levels in Metro Vancouver* this spring due, in large part, to rising interest rates:
The Real Estate Board of Greater Vancouver (REBGV) reports that residential home sales in the region totalled 2,918 in May 2022, a 31.6 per cent decrease from the 4,268 sales recorded in May 2021, and a 9.7 per cent decrease from the 3,232 homes sold in April 2022.
Last month’s sales were 12.9 per cent below the 10-year May sales average. “With interest rates rising, home buyers are taking more time to make their decisions in today’s housing market,” said Daniel John, REBGV Chair. “Home buyers have been operating in a frenzied environment for much of the past two years. This spring is providing a calmer environment, with fewer multiple offer situations, which is allowing buyers to explore their housing options, understand the changing mortgage market, and do their due diligence.”
There were 6,377 detached, attached and apartment properties newly listed for sale on the Multiple Listing Service® (MLS®) in Metro Vancouver in May 2022. This represents a 10.5 per cent decrease compared to the 7,125 homes listed in May 2021 and a 4.4 per cent increase compared to April 2022 when 6,107 homes were listed. The total number of homes currently listed for sale on the MLS® system in Metro Vancouver is 10,010, an 8.8 per cent decrease compared to May 2021 (10,970) and a 13.8 per cent increase compared to April 2022 (8,796).
For all property types, the sales-to-active listings ratio for May 2022 is 29.2 per cent. By property type, the ratio is 18.3 per cent for detached homes, 35.5 per cent for townhomes, and 38.1 per cent for apartments.Generally, analysts say downward pressure on home prices occurs when the ratio dips below 12 per cent for a sustained period, while home prices often experience upward pressure when it surpasses 20 per cent over several months.
The MLS® Home Price Index* composite benchmark price for all residential properties in Metro Vancouver is currently $1,261,1001. This represents a 14.7 per cent increase over May 2021 and a 0.3 per cent decrease compared to April 2022. “Upward pressure on home prices has begun to ease in the housing market over the last two months,” John said. “Where home prices go next will depend on housing supply. While we’re beginning to see modest increases in home listings, we still need housing supply totals to more than double to bring the market close to balanced territory.”
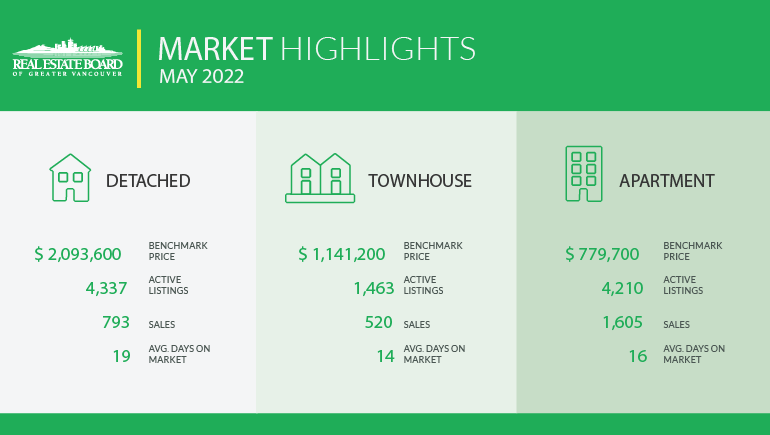
Sales of detached homes in May 2022 reached 793, a 44.1 per cent decrease from the 1,419 detached sales recorded in May 2021. The benchmark price for a detached home is $2,093,600. This represents a 15 per cent increase from May 2021 and a 0.4 per cent decrease compared to April 2022.
Sales of apartment homes reached 1,605 in May 2022, a 21.7 per cent decrease compared to the 2,049 sales in May 2021. The benchmark price of an apartment home is $779,700. This represents a 15 per cent increase from May 2021 and a 0.4 per cent increase compared to April 2022.
Attached home sales in May 2022 totalled 520, a 35 per cent decrease compared to the 800 sales in May 2021. The benchmark price of an attached home is $1,141,200. This represents a 21.5 per cent increase from May 2021 and a 0.6 per cent decrease compared to April 2022.
* Areas covered by the Real Estate Board of Greater Vancouver include: Burnaby, Coquitlam, Maple Ridge, New Westminster, North Vancouver, Pitt Meadows, Port Coquitlam, Port Moody, Richmond, South Delta, Squamish, Sunshine Coast, Vancouver, West Vancouver, and Whistler.
Copyright British Columbia Real Estate Association. Reprinted with permission.
Posted on
June 2, 2022
by
Steve Flynn
As expected, the Bank of Canada raised its overnight policy rate by 0.5 points to 1.5 per cent. In the statement accompanying the decision, the Bank noted that inflation will likely move higher in the near term before beginning to ease later this year. That inflation is occurring against the backdrop of strong Canadian economic activity, widespread labour shortages and strengthening wage growth. While housing activity is moderating, consumer spending is robust and the Bank judges the Canadian economy is clearly operating in excess demand. As a result, the Bank judges that rates will still need to rise further to achieve its 2 per cent inflation target.
The overnight rate is now within 25 basis points of its pre-pandemic level and markets continue to anticipate another 100 basis points of tightening on the horizon. Those future rate increases have largely already been priced into the average 5-year fixed mortgage rate, which has reached 4.29 per cent, its highest level since 2010. The ultimate destination for the overnight rate will depend on the trajectory of inflation over the next few months. While some see signs of inflation peaking, significant upward pressure on consumer prices remains from rising commodity prices and shortages. As a result, we expect mortgage rates may continue to rise this year, with a possibility of testing the 5 per cent level if inflation remains elevated.
Copyright British Columbia Real Estate Association. Reprinted with permission.
Categories:
Abbotsford West, Abbotsford Real Estate
|
Bolivar Heights, North Surrey Real Estate
|
Brentwood Park, Burnaby North Real Estate
|
Brighouse, Richmond Real Estate
|
Burnaby
|
Burnaby Real Estate
|
Burnaby South Real Estate
|
Cape Horn, Coquitlam Real Estate
|
Cariboo, Burnaby North Real Estate
|
Central BN, Burnaby North Real Estate
|
Central Coquitlam, Coquitlam
|
Central Coquitlam, Coquitlam Real Estate
|
Champlain Heights, Vancouver East
|
Champlain Heights, Vancouver East Real Estate
|
Cloverdale BC, Cloverdale Real Estate
|
Cloverdale BC, Surrey Real Estate
|
Cloverdale Real Estate
|
Coal Harbour, Vancouver West Real Estate
|
Coaquitlam
|
College Park PM, Port Moody Real Estate
|
Collingwood VE, Vancouver East Real Estate
|
Coquitlam
|
Coquitlam West, Coquitlam Real Estate
|
Downtown NW, New Westminster Real Estate
|
Downtown VW, Vancouver West
|
Downtown VW, Vancouver West Real Estate
|
Eagleridge, Coquitlam Real Estate
|
False Creek North, Vancouver West
|
Fraserview NW, New Westminster
|
Fraserview NW, New Westminster Real Estate
|
Fraserview VE, Vancouver East Real Estate
|
GlenBrooke North, New Westminster Real Estate
|
Grandview Surrey, Surrey Real Estate
|
Harrison Hot Springs Real Estate
|
Hastings, Vancouver East Real Estate
|
Highgate, Burnaby South Real Estate
|
Hockaday, Coquitlam Real Estate
|
January 2014 Sales in Greater Vancouver
|
Metrotown, Burnaby South Real Estate
|
New Horizons, Coquitlam Real Estate
|
New Westminster Real Estate
|
Port Moody
|
Port Moody Real Estate
|
Quay, New Westminster Real Estate
|
Queensborough, New Westminster Real Estate
|
Richmond Real Estate
|
Riverdale RI, Richmond Real Estate
|
Riverwood, Port Coquitlam Real Estate
|
Sapperton, New Westminster Real Estate
|
Simon Fraser Univer., Burnaby North Real Estate
|
Surrey
|
The Heights NW, New Westminster
|
The Heights NW, New Westminster Real Estate
|
Tsawwassen Central, Tsawwassen Real Estate
|
Uptown NW, New Westminster Real Estate
|
Uptown, New Westminster Real Estate
|
Vancouver
|
Vancouver East Real Estate
|
Videocast of January 2014 sales
|
Walnut Grove, Langley Real Estate
|
West Central, Maple Ridge Real Estate
|
West End VW, Vancouver West Real Estate
|
Whalley, North Surrey Real Estate
|
Whalley, Surrey Real Estate
|
Willoughby Heights, Langley Real Estate
|
 Subscribe with RSS Reader