Posted on
November 29, 2020
by
Steve Flynn
Housing demand in Metro Vancouver* continues to outpace historical averages with November sales eclipsing 3,000 for the first time since 2015.
The Real Estate Board of Greater Vancouver (REBGV) reports that residential home sales in the region totalled 3,064 in November 2020, a 22.7 per cent increase from the 2,498 sales recorded in November 2019, and a 16.9 per cent decrease from the 3,687 homes sold in October 2020.
Last month’s sales were 24.6 per cent above the 10-year November sales average and was the second highest total in this period. “Home buyer demand has been at near record levels in our region since the summer,” Colette Gerber, REBGV Chair said. “This is putting upward pressure on home prices, particularly in our detached and townhome markets."
There were 4,068 detached, attached and apartment homes newly listed for sale on the Multiple Listing Service® (MLS®) in Metro Vancouver in November 2020. This represents a 36.2 per cent increase compared to the 2,987 homes listed in November 2019 and a 27 per cent decrease compared to October 2020 when 5,571 homes were listed.
The total number of homes currently listed for sale on the MLS® system in Metro Vancouver is 11,118, a 3.2 per cent increase compared to November 2019 (10,770) and a 10.5 per cent decrease compared to October 2020 (12,416). "The supply of homes for sale are a critical factor in understanding home price trends," Gerber said. "The total number of homes for sale in Metro Vancouver is lagging behind the pace of demand right now. This trend favours home sellers in today's market."
For all property types, the sales-to-active listings ratio for November 2020 is 27.6 per cent. By property type, the ratio is 27.9 per cent for detached homes, 40.1 per cent for townhomes, and 23.9 per cent for apartments. Generally, analysts say downward pressure on home prices occurs when the ratio dips below 12 per cent for a sustained period, while home prices often experience upward pressure when it surpasses 20 per cent over several months.
Within the region, the Sunshine Coast saw the largest increase in year-over-year demand with 106 home sales in November 2020, an 82.8 per cent increase over November 2019 (58). “While demand remained elevated across the region, home buyer activity was particularly focused in more remote areas like the Sunshine Coast, Gulf Islands and Squamish,” Gerber said. “The rise of work-from-home arrangements and physical distancing policies is causing some home buyers to opt for less densified areas.”
The MLS® Home Price Index composite benchmark price for all residential properties in Metro Vancouver is currently $1,044,000. This represents a 5.8 per cent increase over November 2019 and a 0.1 per cent decrease compared to October 2020.
Sales of detached homes in November 2020 reached 1,061, a 28.6 per cent increase from the 825 detached sales recorded in November 2019. The benchmark price for a detached home is $1,538,900. This represents a 9.4 per cent increase from November 2019 and a one per cent increase compared to October 2020.
Sales of apartment homes reached 1,371 in November 2020, a 12.2 per cent increase compared to the 1,222 sales in November 2019. The benchmark price of an apartment home is $676,500. This represents a 3.4 per cent increase from November 2019 and a one per cent decrease compared to October 2020.
Attached home sales in November 2020 totalled 632, a 40.1 per cent increase compared to the 451 sales in November 2019. The benchmark price of an attached home is $814,800. This represents a 5.6 per cent increase from November 2019 and a 0.2 per cent increase compared to October 2020.
* Areas covered by the Real Estate Board of Greater Vancouver include: Burnaby, Coquitlam, Maple Ridge, New Westminster, North Vancouver, Pitt Meadows, Port Coquitlam, Port Moody, Richmond, South Delta, Squamish, Sunshine Coast, Vancouver, West Vancouver, and Whistler.
Copyright British Columbia Real Estate Association. Reprinted with permission.
Posted on
November 20, 2020
by
Steve Flynn
Retail sales rose for the fifth consecutive month in September by 1.1% on a seasonally-adjusted basis, which is higher than Statistic Canada's preliminary estimate of no change. Sales were up in 9 of 11 subsectors, representing 93.2% of retail sales. The increase was led by higher sales at auto dealers. General merchandise stores increased for the first time in three months, while sales bounced back at furniture and home furnishing stores. Compared to the same time last year, retail sales were up by 8%.
Sales were up in eight provinces in September, with notable increases in PEI (4.4%), New Brunswick (3.8%) and Alberta (2.5%). In BC, seasonally-adjusted retail sales were up by 1.7% ($7.8 billion) and by 0.9% ($3.6 billion) in Vancouver. Retail sales were up in almost half of the subsectors, driven by increased sales at auto dealers, while a notable decline was reported at grocery and liquor stores.
Growth in e-commerce was back up in September by 74% year-over-year, after two consecutive months of declines. In September, e-commerce sales totaled $3.2 billion, accounting for 5.6% of total retails sales, up from 5.1% in August. This excludes Canadians purchasing from foreign e-commerce retailers.
This was a good news report. Nonetheless, rising cases of COVID-19 have led some provinces such as Ontario, Quebec, Manitoba and BC to tighten restrictions, which includes discouraging non-essential travel. This could put a damper on brick and mortar retail sales as we enter the holiday season, while e-commerce could see another boost. Early estimates provided by Statistics Canada suggest that retail sales were unchanged in October.
Copyright British Columbia Real Estate Association. Reprinted with permission.
Posted on
November 16, 2020
by
Steve Flynn
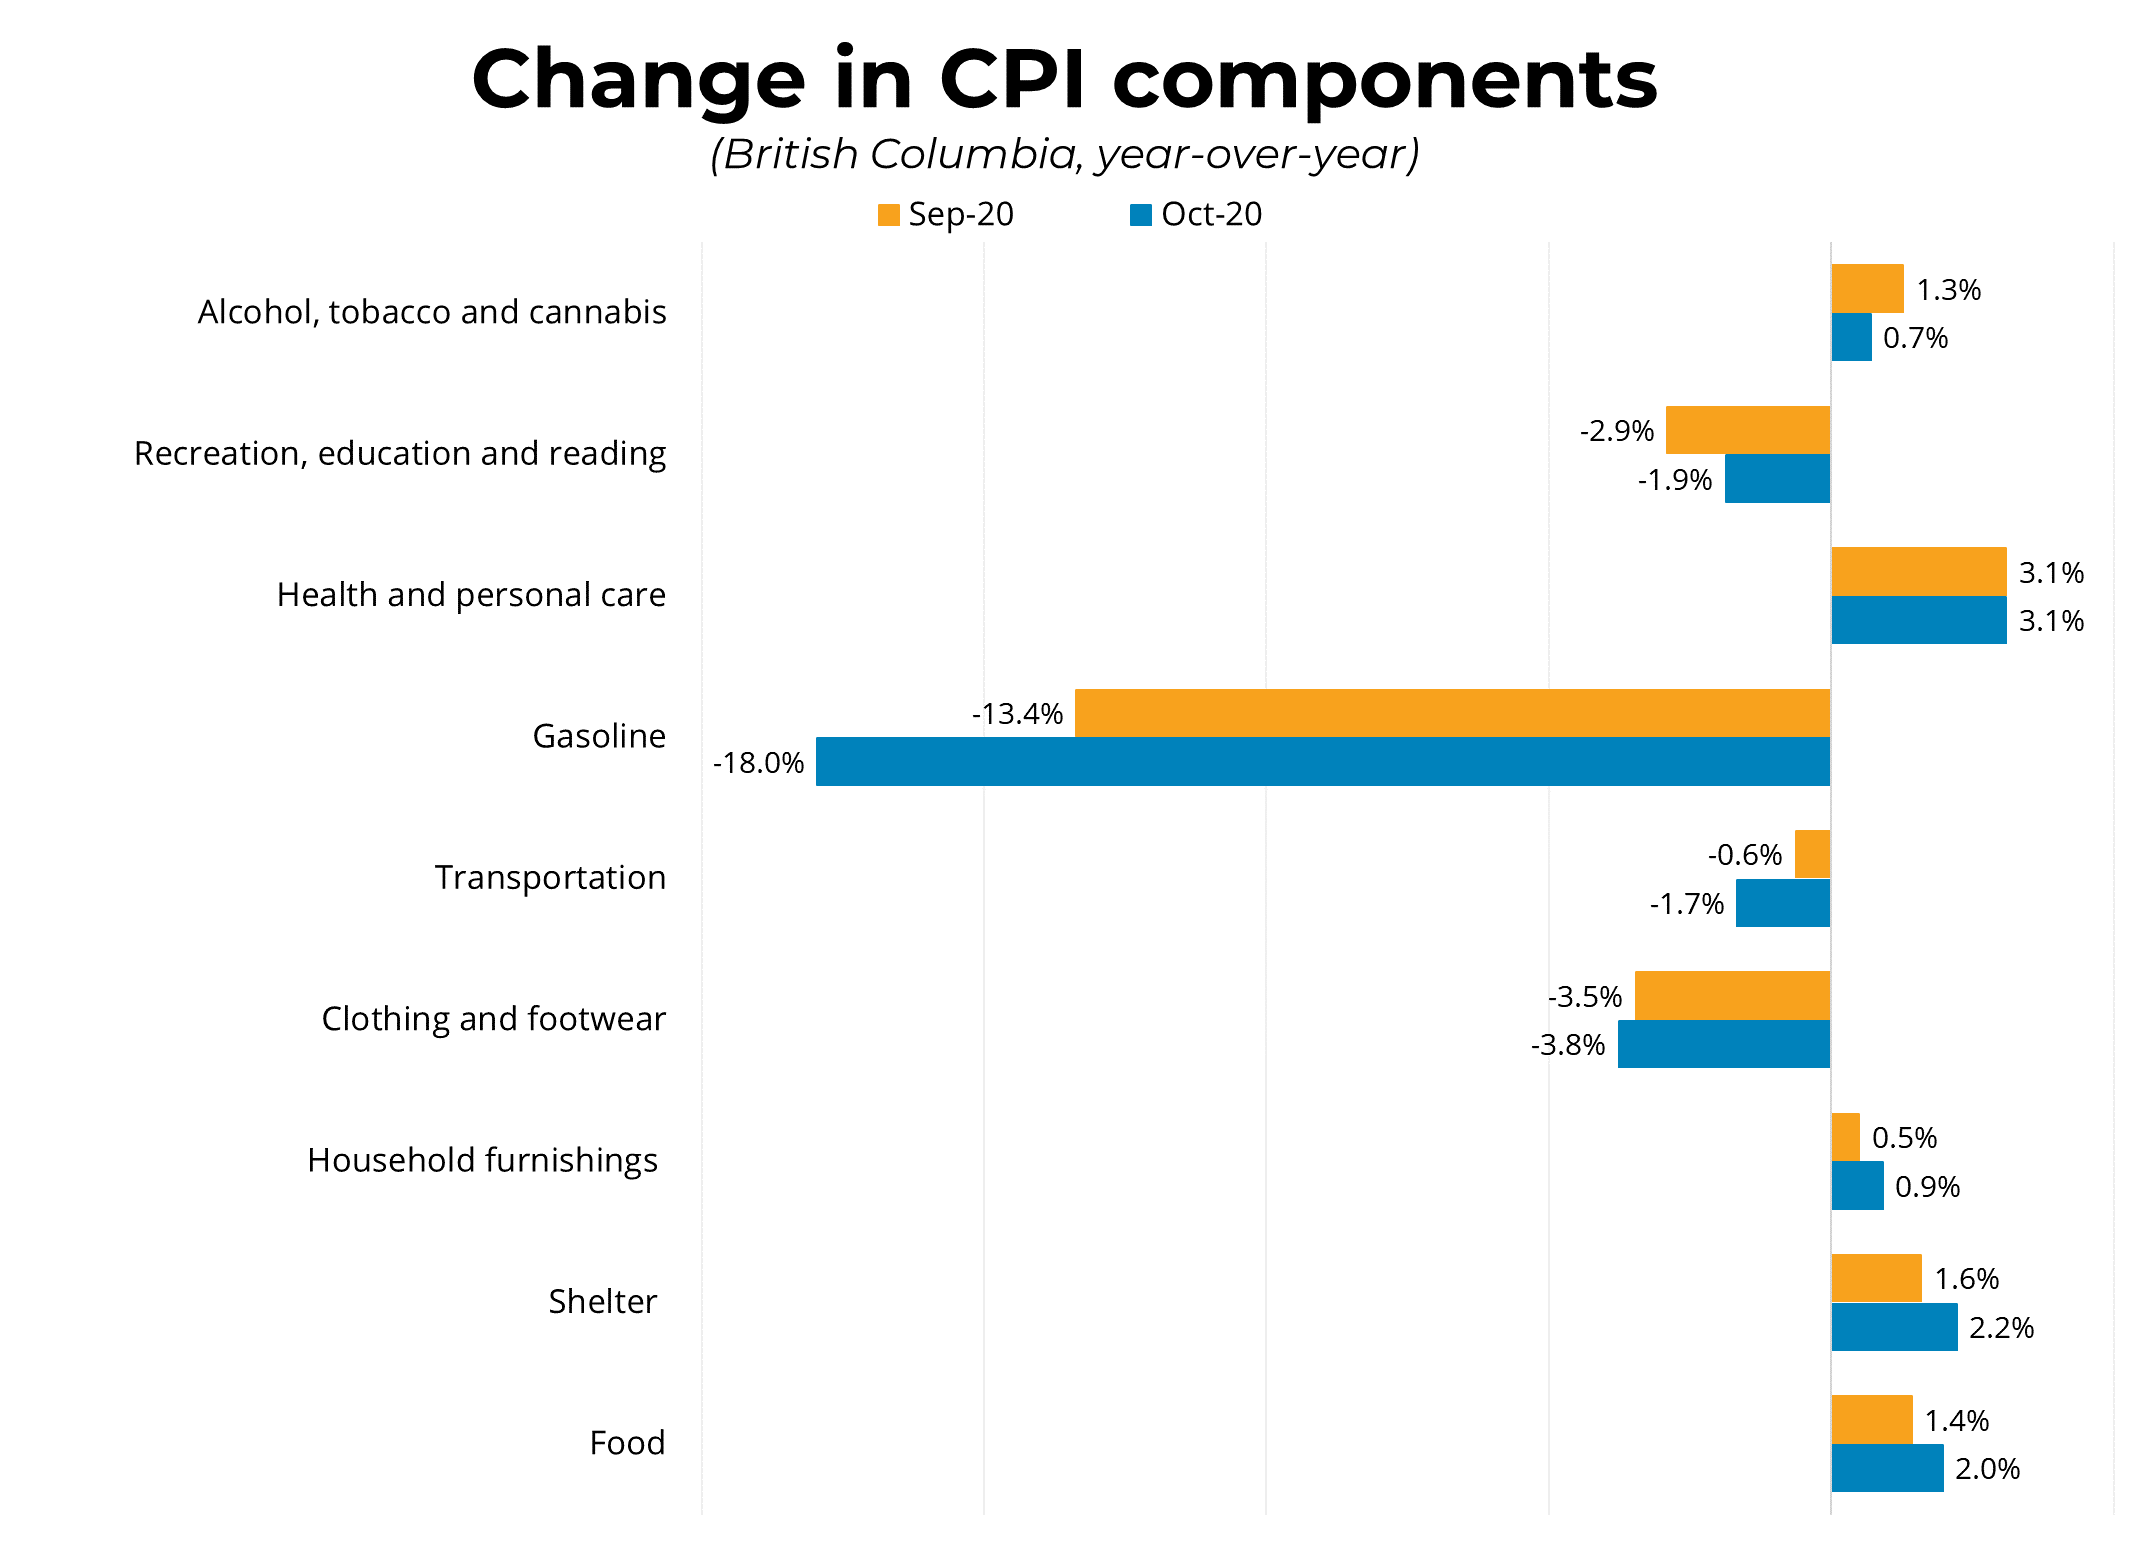
Canadian inflation, as measured by the Consumer Price Index (CPI) rose by 0.7% in October year-over-year, up from the previous month's increase of 0.5%. Excluding gasoline, the CPI rose by 1.1%. Prices rose in five of eight components year-over-year in October, with food contributing the most to the increase due to rising prices for lettuce as a result of disease and inclement weather. Growth in the Bank of Canada's three measures of trend inflation rose by 0.1 percentage points in October, averaging 1.8%.
Regionally, the CPI was positive in all provinces. In BC, CPI rose by 0.5% in October year-over-year, up from September's increase of 0.4%. Strong price growth continued for health and personal care (3.1%), shelter (2.2%), and food (2.0%). In contrast, downward price pressures were ongoing in gas (-18.0%), clothing and footwear (-3.8%), and transportation (-1.7%).
Costs for shelter continue to increase, as record-low interest rates put downward pressure on mortgage costs. This has made single-family homes more attractive to households demanding more space. As provinces such as Ontario and Quebec expand their containment measures, and with new restrictions in BC, Canadian inflation is expected to remain subdued. In this environment, the Bank of Canada will continue to keep interest rates low.
Copyright British Columbia Real Estate Association. Reprinted with permission.
Posted on
November 14, 2020
by
Steve Flynn
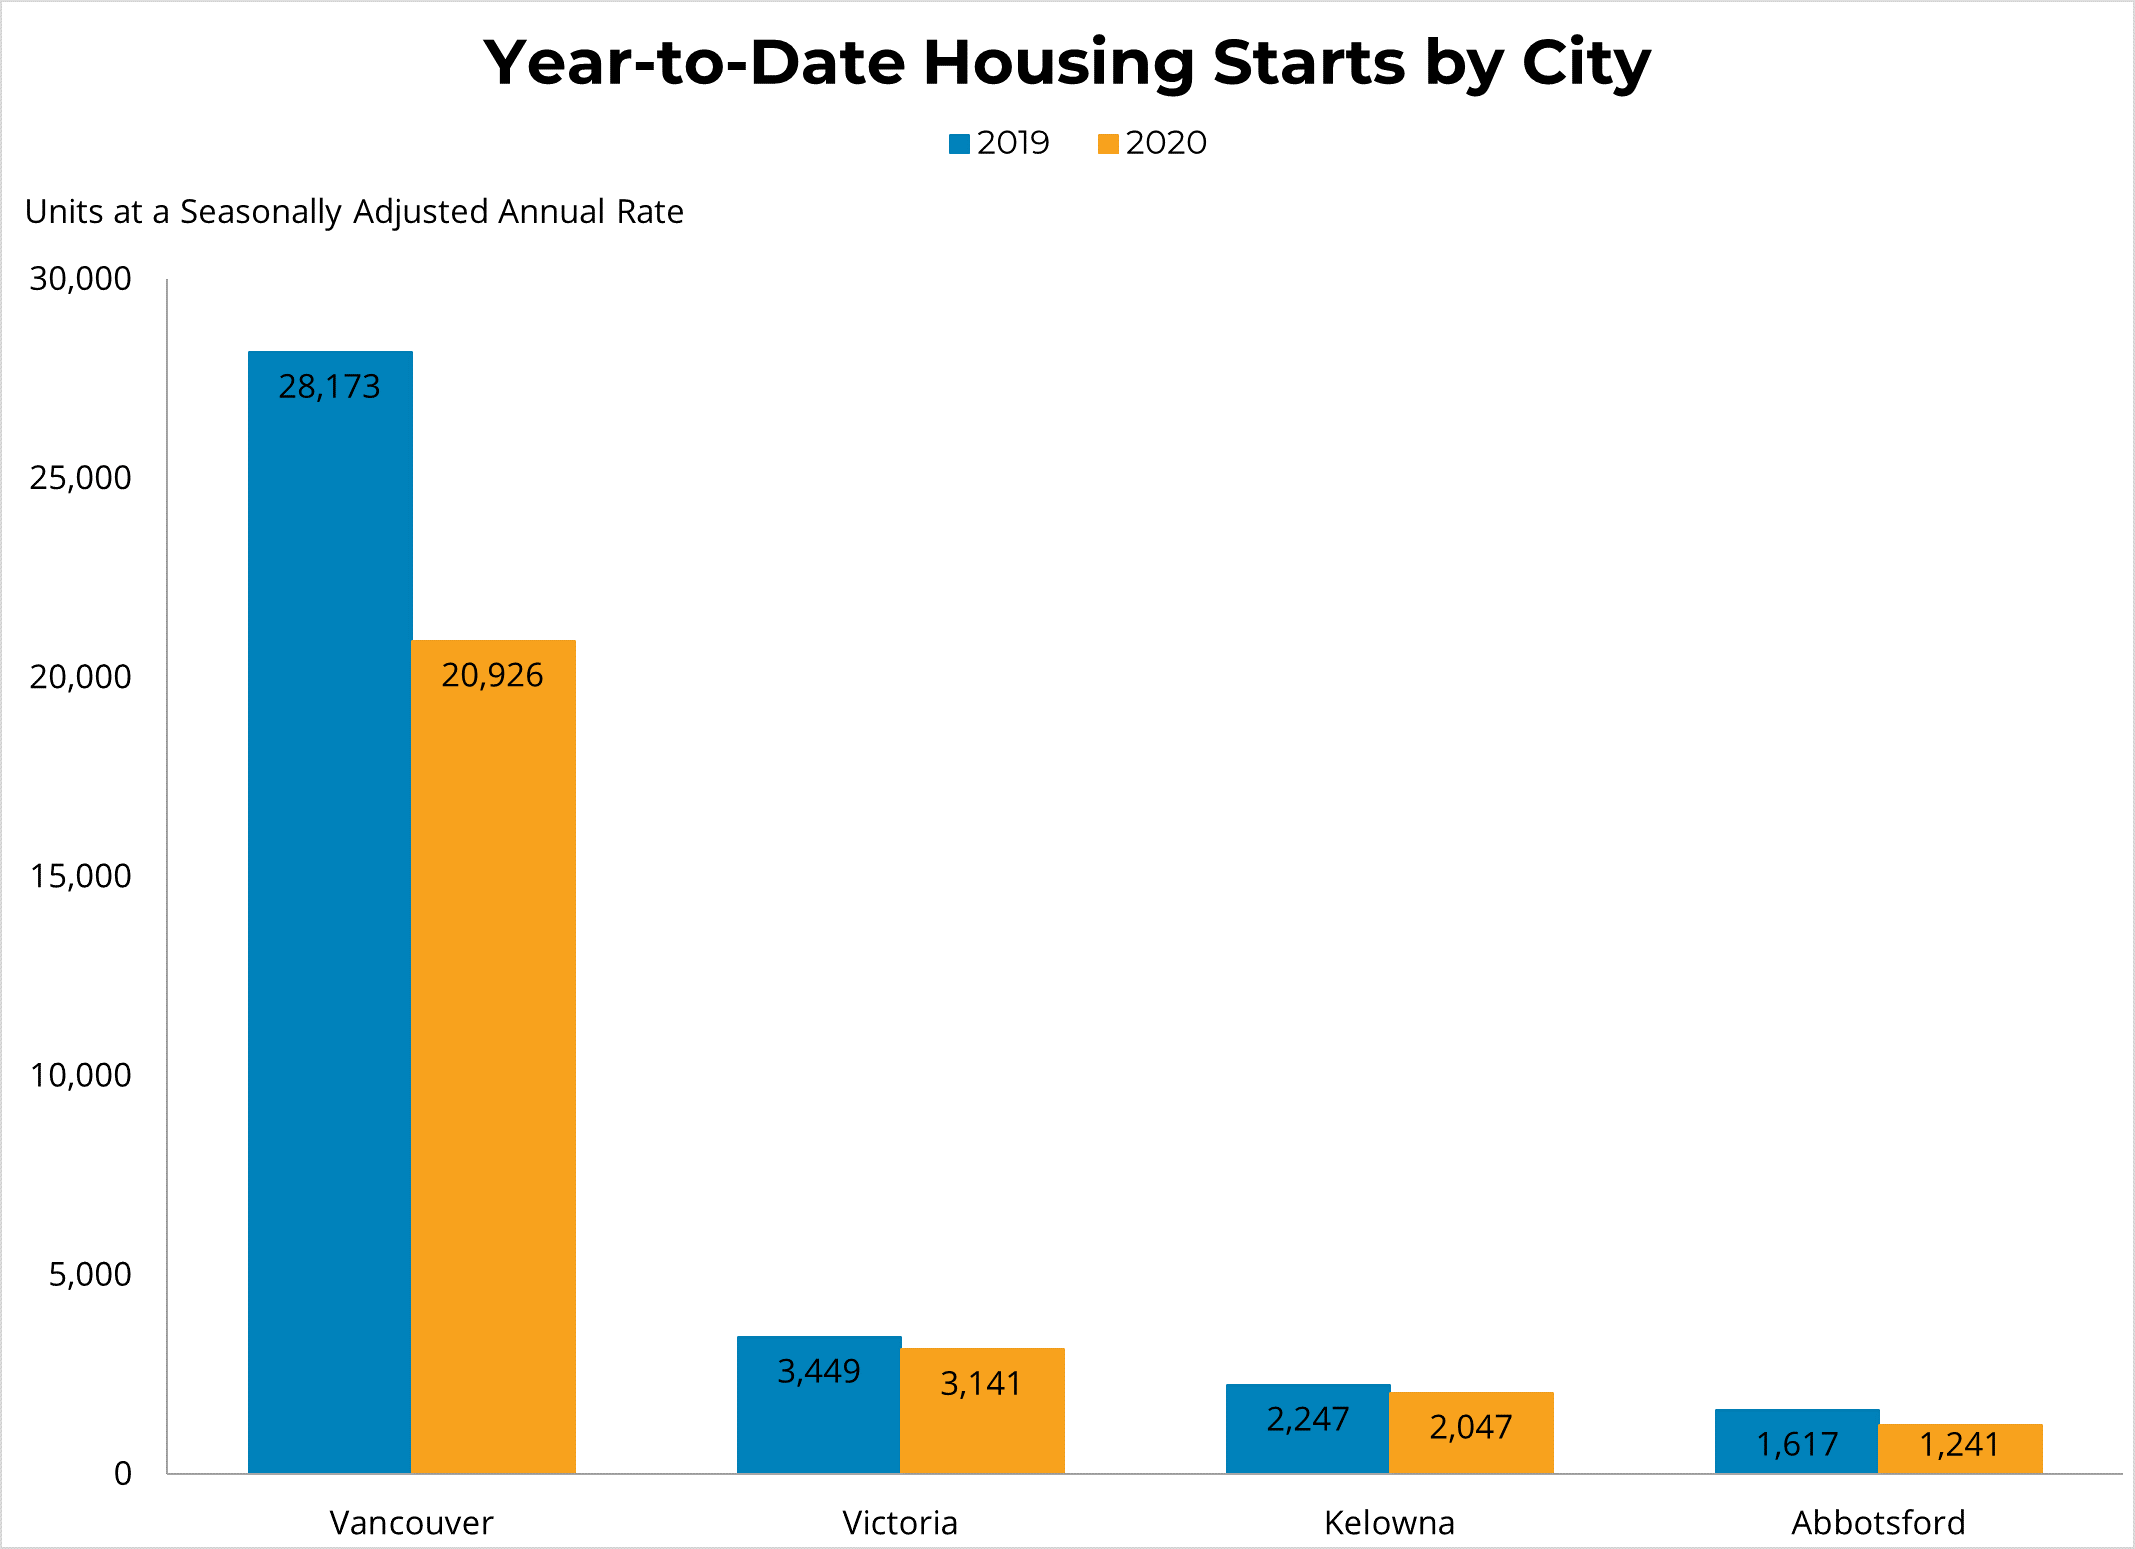
Canadian housing starts increased by 3% m/m to 214,875 units in October at a seasonally adjusted annual rate (SAAR), following a decline in September. Housing starts increased in 6 of 10 provinces with strong gains in Manitoba and Alberta. Building activity gained momentum in the single-detached segment, while multi-unit starts declined slightly. October's healthy number increased the six-month moving average to 222,734 units SAAR.
In BC, housing starts decreased by 6% m/m to 30,381 units SAAR in October, following a decrease of 26% in September. Building activity was up by 6% in the single-detached segment, while multi-unit starts were down by 11%. In the near term, we can expect housing activity to continue to be supported by strong demand and historically low borrowing rates. Meanwhile, the value of residential building permits was up in September by 34%. Compared to the same time last year, housing starts were down by 11% in BC.
Copyright British Columbia Real Estate Association. Reprinted with permission.
Posted on
November 12, 2020
by
Steve Flynn
Vancouver, BC – November 12, 2020
The British Columbia Real Estate Association (BCREA) reports that a total of 11,051 residential unit sales were recorded by the Multiple Listing Service® (MLS®) in October 2020, an increase of 43.8 per cent from October 2019. The average MLS® residential price in BC set a record of $812,960, a 12.5 per cent increase from $722,333 recorded the previous year. Total sales dollar volume in August was $8.98 billion, a 61.8 per cent increase over 2019.
“The provincial housing market sustained its blistering pace of activity in October,” said BCREA Chief Economist Brendon Ogmundson. “While pent-up demand may be starting to fade, record low interest rates and a recovering job market are supporting strong sales.”
“A pandemic-driven shift in buyers’ preference for extra space is pushing average prices to record highs as larger value transactions account for a higher share of sales,” added Ogmundson. Prices are also being pushed higher by a lack of inventory. Total provincial active listings continue to trend lower and were close to 14 per cent lower in October 2020 compared to 2019.
Year-to-date, BC residential sales dollar volume was up 29.7 per cent to $58.7 billion, compared with the same period in 2019. Residential unit sales were up 16.3 per cent to 76,140 units, while the average MLS® residential price was up 11.5 per cent to $771,085.
Copyright British Columbia Real Estate Association. Reprinted with permission.
Posted on
November 10, 2020
by
Steve Flynn
Check out this very informative video of Oct's MLS market activity:

Posted on
November 6, 2020
by
Steve Flynn
Canadian employment gained 84k jobs in October (0.5%, m/m), following a gain of 378k in September. This is the sixth consecutive month of increases, putting national employment within 636k of its pre-COVID February level. The national unemployment rate was little changed at 8.9%, as some provinces reinstated containment measures targeted at restaurants and bars, and recreational facilities. Compared to the same month last year, Canadian employment was down by 3.1% (-598k).
Regionally, employment increased in five provinces, with the largest gains in BC and Ontario. In BC, employment grew by 33.5k (1.4%, m/m) in October, following a gain of 55k in September. The province is now at 97% of its pre-COVID February employment level. The unemployment rate fell for the fifth consecutive month, down by 0.4 percentage points to 8.0%. Meanwhile, in Vancouver, employment increased by 52k jobs (3.8%, m/m). Compared to one year ago, employment in BC was down by 3.3% (-86K) jobs.
As expected, employment recovery was slower in October than the jumps we saw earlier on. Gains in industries that were hardest hit reported some backpedaling in October, as a few provinces reinstated containment measures. As COVID-19 cases continue to rise, the path to recovery will be tougher, especially if containment measures in Ontario and Quebec are prolonged, and if other provinces/territories decide to follow suit.
Copyright British Columbia Real Estate Association. Reprinted with permission.
Posted on
November 3, 2020
by
Steve Flynn
Posted on
November 3, 2020
by
Steve Flynn
Home sale and new listing activity remained at near record levels across Metro Vancouver* in October:
The Real Estate Board of Greater Vancouver (REBGV) reports that residential home sales in the region totalled 3,687 in October 2020, a 29 per cent increase from the 2,858 sales recorded in October 2019, and a 1.2 per cent increase from the 3,643 homes sold in September 2020.Last month’s sales were 34.7 per cent above the 10-year October sales average and stands as the second-highest total on record for the month.
“Home has been a focus for residents during the pandemic. With more days and evenings spent at home this year, people are re-thinking their housing situation," Colette Gerber, REBGV Chair said. “Throughout this period, REALTORS® have been working to understand and adapt to the latest safety protocols so that they can continue to help the public meet their housing needs in a safe and responsible way.”
There were 5,571 detached, attached and apartment homes newly listed for sale on the Multiple Listing Service® (MLS®) in Metro Vancouver in October 2020. This represents a 36.7 per cent increase compared to the 4,074 homes listed in October 2019 and a 13 per cent decrease compared to September 2020 when 6,402 homes were listed.
The total number of homes currently listed for sale on the MLS® system in Metro Vancouver is 12,416, a 1.5 per cent increase compared to October 2019 (12,236) and a 5.2 per cent decrease compared to September 2020 (13,096). “With demand on the rise, homes priced right for today’s market are receiving attention and, at times, garnering multiple offers," Gerber said. "To understand the market conditions in your neighbourhood and property type of choice, work with your local REALTOR® to assess the latest MLS® housing market information."
For all property types, the sales-to-active listings ratio for October 2020 is 29.7 per cent. By property type, the ratio is 30.9 per cent for detached homes, 43.5 per cent for townhomes, and 24.9 per cent for apartments. Generally, analysts say downward pressure on home prices occurs when the ratio dips below 12 per cent for a sustained period, while home prices often experience upward pressure when it surpasses 20 per cent over several months.
The MLS® Home Price Index composite benchmark price for all residential properties in Metro Vancouver is currently $1,045,100. This represents a six per cent increase over October 2019 and a 0.4 per cent increase compared to September 2020.
Sales of detached homes in October 2020 reached 1,335, a 42.3 per cent increase from the 938 detached sales recorded in October 2019. The benchmark price for a detached home is $1,523,800. This represents an 8.5 per cent increase from October 2019 and a 1.1 per cent increase compared to September 2020.
Sales of apartment homes reached 1,570 in October 2020, a 13.4 per cent increase compared to the 1,384 sales in October 2019. The benchmark price of an apartment property is $683,500. This represents a 4.4 per cent increase from October 2019 and is unchanged compared to September 2020.
Attached home sales in October 2020 totalled 782, a 45.9 per cent increase compared to the 536 sales in October 2019. The benchmark price of an attached home is $813,000. This represents a 5.4 per cent increase from October 2019 and a 0.4 per cent increase compared to September 2020.
* Areas covered by the Real Estate Board of Greater Vancouver include: Burnaby, Coquitlam, Maple Ridge, New Westminster, North Vancouver, Pitt Meadows, Port Coquitlam, Port Moody, Richmond, South Delta, Squamish, Sunshine Coast, Vancouver, West Vancouver, and Whistler.
Copyright British Columbia Real Estate Association. Reprinted with permission.
Categories:
Abbotsford West, Abbotsford Real Estate
|
Bolivar Heights, North Surrey Real Estate
|
Brentwood Park, Burnaby North Real Estate
|
Brighouse, Richmond Real Estate
|
Burnaby
|
Burnaby Real Estate
|
Burnaby South Real Estate
|
Cape Horn, Coquitlam Real Estate
|
Cariboo, Burnaby North Real Estate
|
Central BN, Burnaby North Real Estate
|
Central Coquitlam, Coquitlam
|
Central Coquitlam, Coquitlam Real Estate
|
Champlain Heights, Vancouver East
|
Champlain Heights, Vancouver East Real Estate
|
Cloverdale BC, Cloverdale Real Estate
|
Cloverdale BC, Surrey Real Estate
|
Cloverdale Real Estate
|
Coal Harbour, Vancouver West Real Estate
|
Coaquitlam
|
College Park PM, Port Moody Real Estate
|
Collingwood VE, Vancouver East Real Estate
|
Coquitlam
|
Coquitlam West, Coquitlam Real Estate
|
Downtown NW, New Westminster Real Estate
|
Downtown VW, Vancouver West
|
Downtown VW, Vancouver West Real Estate
|
Eagleridge, Coquitlam Real Estate
|
False Creek North, Vancouver West
|
Fraserview NW, New Westminster
|
Fraserview NW, New Westminster Real Estate
|
Fraserview VE, Vancouver East Real Estate
|
GlenBrooke North, New Westminster Real Estate
|
Grandview Surrey, Surrey Real Estate
|
Harrison Hot Springs Real Estate
|
Hastings, Vancouver East Real Estate
|
Highgate, Burnaby South Real Estate
|
Hockaday, Coquitlam Real Estate
|
January 2014 Sales in Greater Vancouver
|
Metrotown, Burnaby South Real Estate
|
New Horizons, Coquitlam Real Estate
|
New Westminster Real Estate
|
Port Moody
|
Port Moody Real Estate
|
Quay, New Westminster Real Estate
|
Queensborough, New Westminster Real Estate
|
Richmond Real Estate
|
Riverdale RI, Richmond Real Estate
|
Riverwood, Port Coquitlam Real Estate
|
Sapperton, New Westminster Real Estate
|
Simon Fraser Univer., Burnaby North Real Estate
|
Surrey
|
The Heights NW, New Westminster
|
The Heights NW, New Westminster Real Estate
|
Tsawwassen Central, Tsawwassen Real Estate
|
Uptown NW, New Westminster Real Estate
|
Uptown, New Westminster Real Estate
|
Vancouver
|
Vancouver East Real Estate
|
Videocast of January 2014 sales
|
Walnut Grove, Langley Real Estate
|
West Central, Maple Ridge Real Estate
|
West End VW, Vancouver West Real Estate
|
Whalley, North Surrey Real Estate
|
Whalley, Surrey Real Estate
|
Willoughby Heights, Langley Real Estate
|
 Subscribe with RSS Reader