Posted on
November 30, 2021
by
Steve Flynn
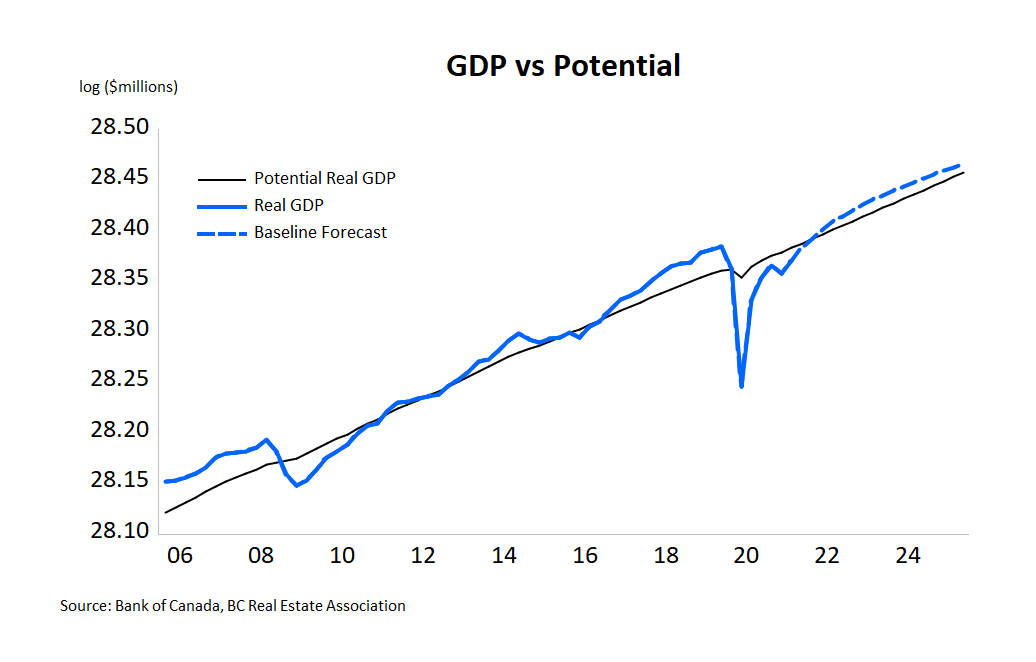
The Canadian economy grew at a 5.4 per cent annual rate in the third quarter, driven by strong spending by households and gains in exports. Households continue to be a strong engine of the recovery, with continued growth in spending on goods but also a welcome return to spending on services as that part of the economy re-opens. That spending was fueled by the largest growth in employee compensation since the year 2000 with wages rising close to 4 per cent in BC and over 3 per cent in both Alberta and Ontario. Strong wage growth and a sixth straight quarter of a double-digit household savings rate signals strong growth ahead for the Canadian economy.
That said, the global economic environment continues to be a confusing mix of booming demand, gummed-up supply chains and an ongoing COVID-19 pandemic. While it appears that the Canadian economy is primed for strong growth, as a small open economy that growth very much depends on the smooth functioning of global supply and demand. As long as supply chains remain challenged, and a further challenge was just thrown their way by flooding across BC’s rail and highway network, growth will continue to be impeded. Fortunately, these are solvable issues that simply need time. Even with choppy growth this year, the Canadian economy will expand close to 5 per cent in 2021 after contracting 5.3 per cent last year. We forecast that the economy will enjoy strong growth in 2022, with real GDP growth of 4 per cent. That growth profile would put the economy on track to return to its potential by mid-2022, as projected by the Bank of Canada.
Copyright British Columbia Real Estate Association. Reprinted with permission.
Posted on
November 20, 2021
by
Steve Flynn
Canadian seasonally-adjusted retail sales fell 0.6% to $56.6 billion in September. The decline was driven by sales at motor vehicle and parts dealers (-1.6%) as new car sales continued to be impacted by semiconductor chip supply shortages. According to Statistics Canada's survey, just 0.5% of retailers were closed at some point in September. Preliminary estimates, based on roughly 50% of respondents reporting so far to the agency, indicate that retail sales rose 1% in October.
In BC, sales rose 1.1% to a fresh record in September, erasing declines in July and August. Compared to the same month last year, retail sales were up 6.7% in the province. Only electronics and appliance sales and building material or garden equipment were not up on a year-over-year basis in September. In the Greater Vancouver region, sales fell 0.6% month-over-month and were up 10.3% year-over-year.
In September, Canadian e-commerce sales rose from $3 billion to $3.2 billion. As a result, e-commerce increased from 4.9% of total retail sales in August to 5.3% in September. This percentage is lower than at most points since the onset of the pandemic but is elevated compared to pre-pandemic levels.
Copyright British Columbia Real Estate Association. Reprinted with permission.
Posted on
November 18, 2021
by
Steve Flynn
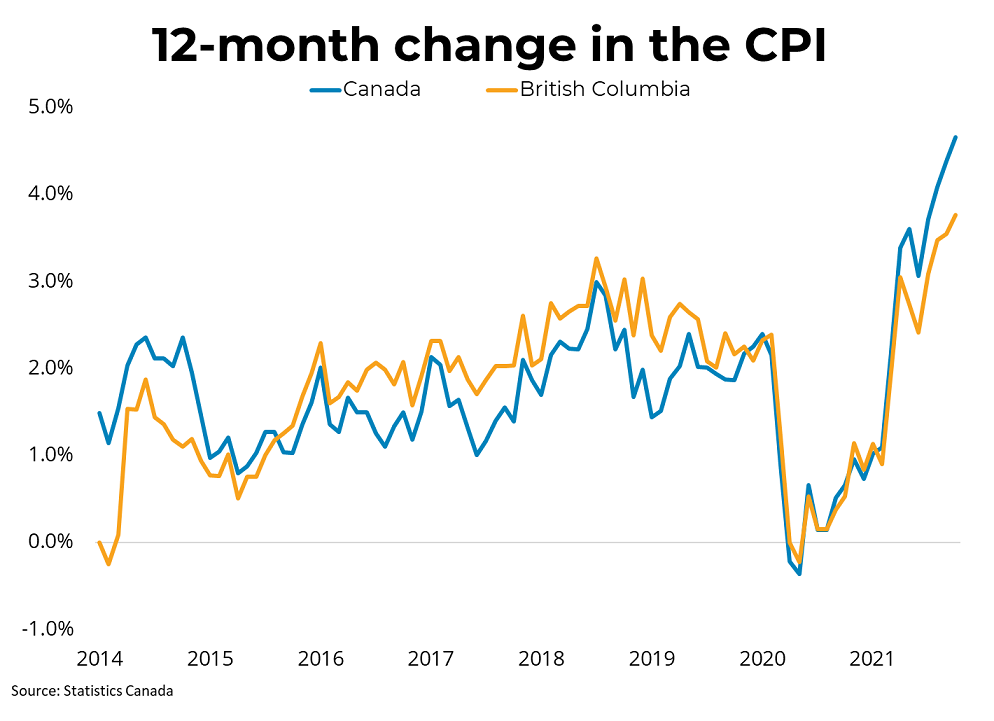
Canadian prices, as measured by the Consumer Price Index (CPI), rose 4.7% on a year-over-year basis in October, rising at the fastest rate since 2003. On a month-over-month basis, the CPI was up 0.7% in October. The Bank of Canada's preferred measures of core inflation (which use techniques to strip out volatile elements) rose an average of 2.7% year-over-year in October. Major drivers of the year-over-year price increase included transportation prices (+10.1%), shelter (+4.8%) and food prices (+3.8%) partly on continuing supply-chain difficulties. In BC, consumer prices were up 0.43% month-over-month, and up 3.8% on a year-over-year basis.
Inflation continues to run ahead of the Bank of Canada's 2 per cent target. The driving force behind rising prices in October was a 10% increase in transportation costs due to rising gasoline prices. Inflation from shelter costs was up month-over-month as home prices trended higher after flattening out over the summer. Those categories continue to account for about 60% of the year-over-year rise in consumer prices. We expect this elevated level of inflation to persist through next year before prices begin moderating. The Bank of Canada is clearly concerned about rising consumer prices and have signaled that it will begin raising its policy rate in the second or third quarter of 2022.
Copyright British Columbia Real Estate Association. Reprinted with permission.
Posted on
November 16, 2021
by
Steve Flynn
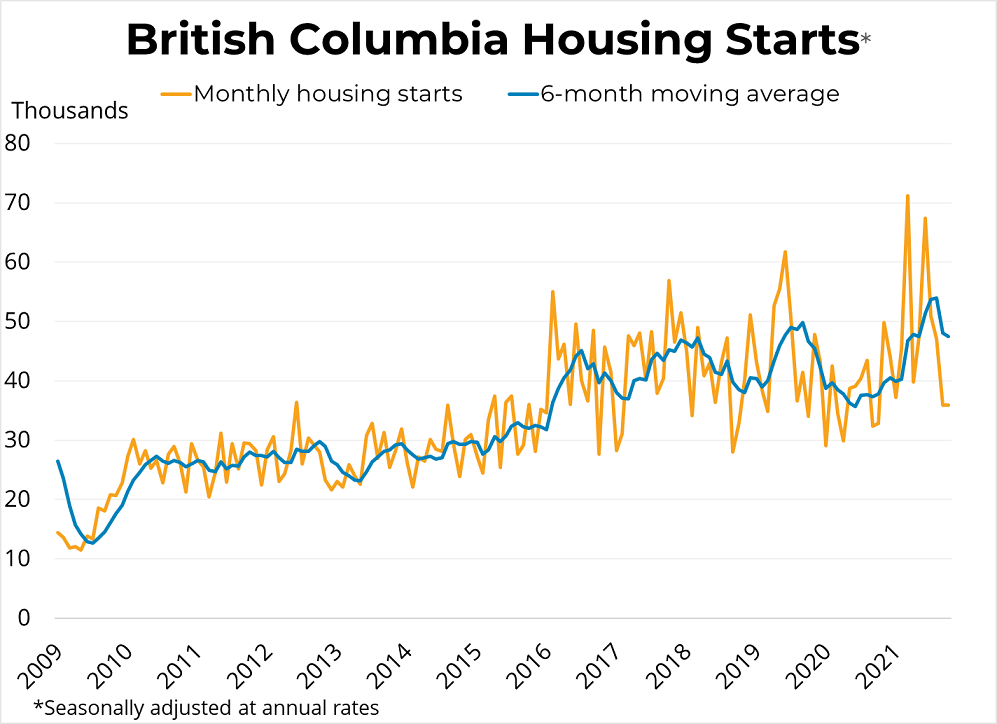
Canadian housing starts declined for the fifth consecutive month in October, but remain somewhat strong compared to typical pre-pandemic activity. Housing starts decreased by 13.4k to 236.6k units (-5.3% m/m) in October at a seasonally-adjusted annual rate (SAAR). Comparing year-over-year, starts were up modestly from October of 2020 (4.1% y/y). Single-detached housing starts dipped 3.7% in October to 73.4k, while multi-family and others declined 6% to 163.2k (SAAR).
In British Columbia, starts were essentially unchanged in October, maintaining the level of 35.9k units SAAR in all areas of the province. Single-detached starts dropped 5.6% m/m to 7.5k units while multi-family starts offset this drop with a 5.9% rise to 25k units. Starts in the province remained 9.2% above the levels from October 2020. BC's six-month moving average for starts declined slightly, but remains elevated by historical standards.
Copyright British Columbia Real Estate Association. Reprinted with permission.
Posted on
November 10, 2021
by
Steve Flynn
The British Columbia Real Estate Association (BCREA) reports that a total 9,593 residential unit sales were recorded by the Multiple Listing Service® (MLS®) in October 2021, a decrease of 13.7 per cent from October 2020. The average MLS® residential price in BC was $964,777, an 18.9 per cent increase from $811,307 recorded in October 2020. Total sales dollar volume was $9.3 billion, a 2.6 per cent decline from the same time last year.
“The story across the province continues to be the record low number of listings,” said BCREA Chief Economist Brendon Ogmundson. “Rising mortgage rates should start to temper sales activity next year, but even with a moderation in demand it will take quite some time for the inventory of homes to return to a healthy level.”
Total active residential listings were down nearly 40 per cent year-over-year in October, falling to an all-time record low for the province. Active listings have now fallen for five consecutive months on a seasonally adjusted basis.
Year-to-date, BC residential sales dollar volume is up 69.7 per cent to $99.6 billion compared to the same period in 2020. Residential unit sales were up 42.8 per cent to 108,798 units, while the average MLS® residential price was up 18.8 per cent to $915,833.
Copyright British Columbia Real Estate Association. Reprinted with permission.
Posted on
November 5, 2021
by
Steve Flynn
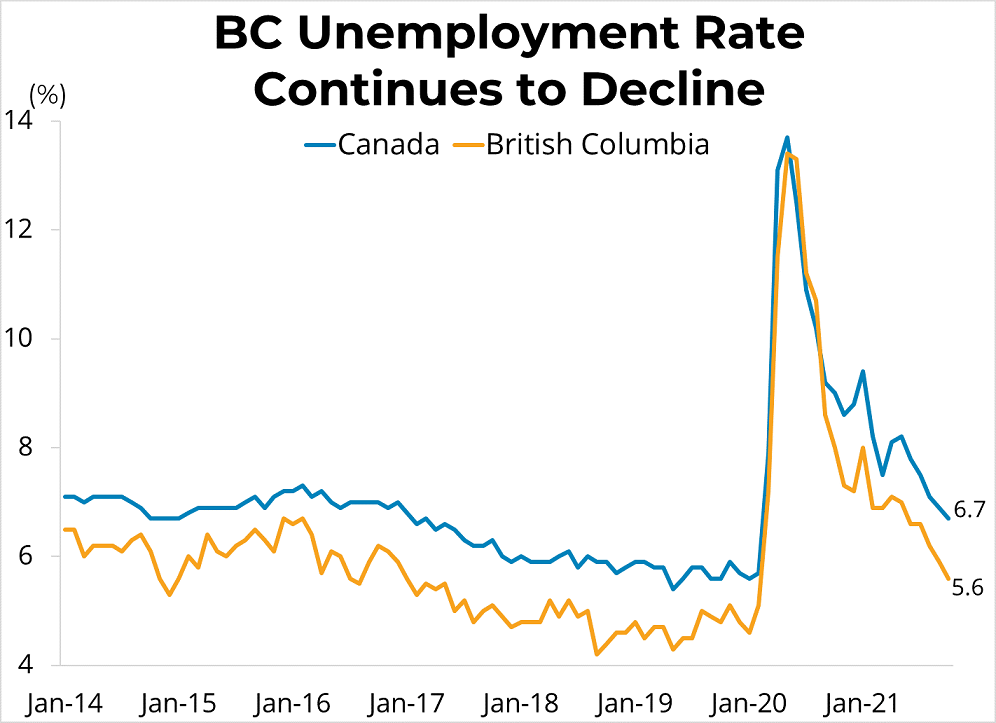
Canadian employment grew for the fifth consecutive month in October according to Statistics Canada, inching up by 31,000 to 19.162 million (0.2%, m/m). Canadian employment had recovered to its pre-pandemic level in September and remains above that level in October. Since the prior survey period, proof-of-vaccination initiatives continued to be implemented in workforces across the country while capacity limits were lifted.
Across Canada, employment gains in retail trade (+72,000) were offset by declines in accommodation and food services (-27,000). The gains in retail trade pushed employment in this sector back to its pre-pandemic level in October. The Canadian unemployment rate declined for a fifth consecutive month to 6.7%, the lowest level since the onset of the pandemic. The unemployment rate is now within 1% of the rate in February of 2020 (5.7%).
In BC, employment grew by 10,400 to 2.692 million (0.39%, m/m), once again hitting the highest level since the pandemic began. The unemployment rate declined by 0.3 in October to 5.6%, the lowest level since the pandemic began. Only Manitoba has a lower unemployment rate in Canada, while Quebec is tied with BC for the second-lowest rate.
Copyright British Columbia Real Estate Association. Reprinted with permission.
Posted on
November 3, 2021
by
Steve Flynn
The MLS® Home Price Index composite benchmark price for all residential properties in Metro Vancouver* is currently $1,199,400. This represents a 14.7% increase from October 2020 and 1.1% increase compared to September 2021.
Specifically:
- The benchmark price for detached homes increased 1.2% from Sep 2021 and increasd 20.5% from Oct 2020.
- The benchmark price for townhouses increased 1.2% from Sep 2021 and increased 18.5% from Oct 2020.
- The benchmark price for apartment/condos increased 1.1% from Sep 2021 and increased 9.5% from Oct 2020.
* Areas covered by the Real Estate Board of Greater Vancouver include: Burnaby, Coquitlam, Maple Ridge, New Westminster, North Vancouver, Pitt Meadows, Port Coquitlam, Port Moody, Richmond, South Delta, Squamish, Sunshine Coast, Vancouver, West Vancouver, and Whistler.
Copyright British Columbia Real Estate Association. Reprinted with permission.
Posted on
November 2, 2021
by
Steve Flynn
Home sale activity in Metro Vancouver* remained above historical averages in October while the overall supply of homes for sale dipped to levels not seen in three years:
The Real Estate Board of Greater Vancouver (REBGV) reports that residential home sales in the region totalled 3,494 in October 2021, a 5.2 per cent decrease from the 3,687 sales recorded in October 2020, and an 11 per cent increase from the 3,149 homes sold in September 2021. Last month’s sales were 22.4 per cent above the 10-year October sales average.
“Home sale activity continues to outpace what’s typical for this time of year and the pool of homes available for sale is in decline. This dynamic between supply and demand is causing home prices to continue to edge up across the region,” Keith Stewart, REBGV economist said.
There were 4,049 detached, attached and apartment properties newly listed for sale on the Multiple Listing Service® (MLS®) in Metro Vancouver in October 2021. This represents a 27.3 per cent decrease compared to the 5,571 homes listed in October 2020 and a 21.7 per cent decrease compared to September 2021 when 5,171 homes were listed.
The total number of homes currently listed for sale on the MLS® system in Metro Vancouver is 8,034, a 35.3 per cent decrease compared to October 2020 (12,416) and a 13 per cent decrease compared to September 2021 (9,236). “Rising fixed mortgage rates should eventually help ease demand, but for now sales remain strong and buyers with rate holds will remain motivated to find a property for the rest of the year,” Stewart said.
For all property types, the sales-to-active listings ratio for October 2021 is 43.5 per cent. By property type, the ratio is 33.6 per cent for detached homes, 64.4 per cent for townhomes, and 46.7 per cent for apartments. Generally, analysts say downward pressure on home prices occurs when the ratio dips below 12 per cent for a sustained period, while home prices often experience upward pressure when it surpasses 20 per cent over several months.
The MLS® Home Price Index composite benchmark price for all residential homes in Metro Vancouver is $1,199,400. This represents a 14.7 per cent increase over October 2020 and a 1.1 per cent increase compared to September 2021.
Sales of detached homes in October 2021 reached 1,090, an 18.4 per cent decrease from the 1,335 detached sales recorded in October 2020. The benchmark price for a detached home is $1,850,500. This represents a 20.5 per cent increase from October 2020 and a 1.2 per cent increase compared to September 2021.
Sales of apartment homes reached 1,801 in October 2021, a 14.7 per cent increase compared to the 1,570 sales in October 2020. The benchmark price of an apartment home is $746,400. This represents a 9.5 per cent increase from October 2020 and a 1.1 per cent increase compared to September 2021.
Attached home sales in October 2021 totalled 603, a 22.9 per cent decrease compared to the 782 sales in October 2020. The benchmark price of an attached home is $975,000. This represents an 18.5 per cent increase from October 2020 and a 1.2 per cent increase compared to September 2021.
* Areas covered by the Real Estate Board of Greater Vancouver include: Burnaby, Coquitlam, Maple Ridge, New Westminster, North Vancouver, Pitt Meadows, Port Coquitlam, Port Moody, Richmond, South Delta, Squamish, Sunshine Coast, Vancouver, West Vancouver, and Whistler.
Copyright British Columbia Real Estate Association. Reprinted with permission.
Categories:
Abbotsford West, Abbotsford Real Estate
|
Bolivar Heights, North Surrey Real Estate
|
Brentwood Park, Burnaby North Real Estate
|
Brighouse, Richmond Real Estate
|
Burnaby
|
Burnaby Real Estate
|
Burnaby South Real Estate
|
Cape Horn, Coquitlam Real Estate
|
Cariboo, Burnaby North Real Estate
|
Central BN, Burnaby North Real Estate
|
Central Coquitlam, Coquitlam
|
Central Coquitlam, Coquitlam Real Estate
|
Champlain Heights, Vancouver East
|
Champlain Heights, Vancouver East Real Estate
|
Cloverdale BC, Cloverdale Real Estate
|
Cloverdale BC, Surrey Real Estate
|
Cloverdale Real Estate
|
Coal Harbour, Vancouver West Real Estate
|
Coaquitlam
|
College Park PM, Port Moody Real Estate
|
Collingwood VE, Vancouver East Real Estate
|
Coquitlam
|
Coquitlam West, Coquitlam Real Estate
|
Downtown NW, New Westminster Real Estate
|
Downtown VW, Vancouver West
|
Downtown VW, Vancouver West Real Estate
|
Eagleridge, Coquitlam Real Estate
|
False Creek North, Vancouver West
|
Fraserview NW, New Westminster
|
Fraserview NW, New Westminster Real Estate
|
Fraserview VE, Vancouver East Real Estate
|
GlenBrooke North, New Westminster Real Estate
|
Grandview Surrey, Surrey Real Estate
|
Harrison Hot Springs Real Estate
|
Hastings, Vancouver East Real Estate
|
Highgate, Burnaby South Real Estate
|
Hockaday, Coquitlam Real Estate
|
January 2014 Sales in Greater Vancouver
|
Metrotown, Burnaby South Real Estate
|
New Horizons, Coquitlam Real Estate
|
New Westminster Real Estate
|
Port Moody
|
Port Moody Real Estate
|
Quay, New Westminster Real Estate
|
Queensborough, New Westminster Real Estate
|
Richmond Real Estate
|
Riverdale RI, Richmond Real Estate
|
Riverwood, Port Coquitlam Real Estate
|
Sapperton, New Westminster Real Estate
|
Simon Fraser Univer., Burnaby North Real Estate
|
Surrey
|
The Heights NW, New Westminster
|
The Heights NW, New Westminster Real Estate
|
Tsawwassen Central, Tsawwassen Real Estate
|
Uptown NW, New Westminster Real Estate
|
Uptown, New Westminster Real Estate
|
Vancouver
|
Vancouver East Real Estate
|
Videocast of January 2014 sales
|
Walnut Grove, Langley Real Estate
|
West Central, Maple Ridge Real Estate
|
West End VW, Vancouver West Real Estate
|
Whalley, North Surrey Real Estate
|
Whalley, Surrey Real Estate
|
Willoughby Heights, Langley Real Estate
|
 Subscribe with RSS Reader