Posted on
March 15, 2025
by
Steve Flynn
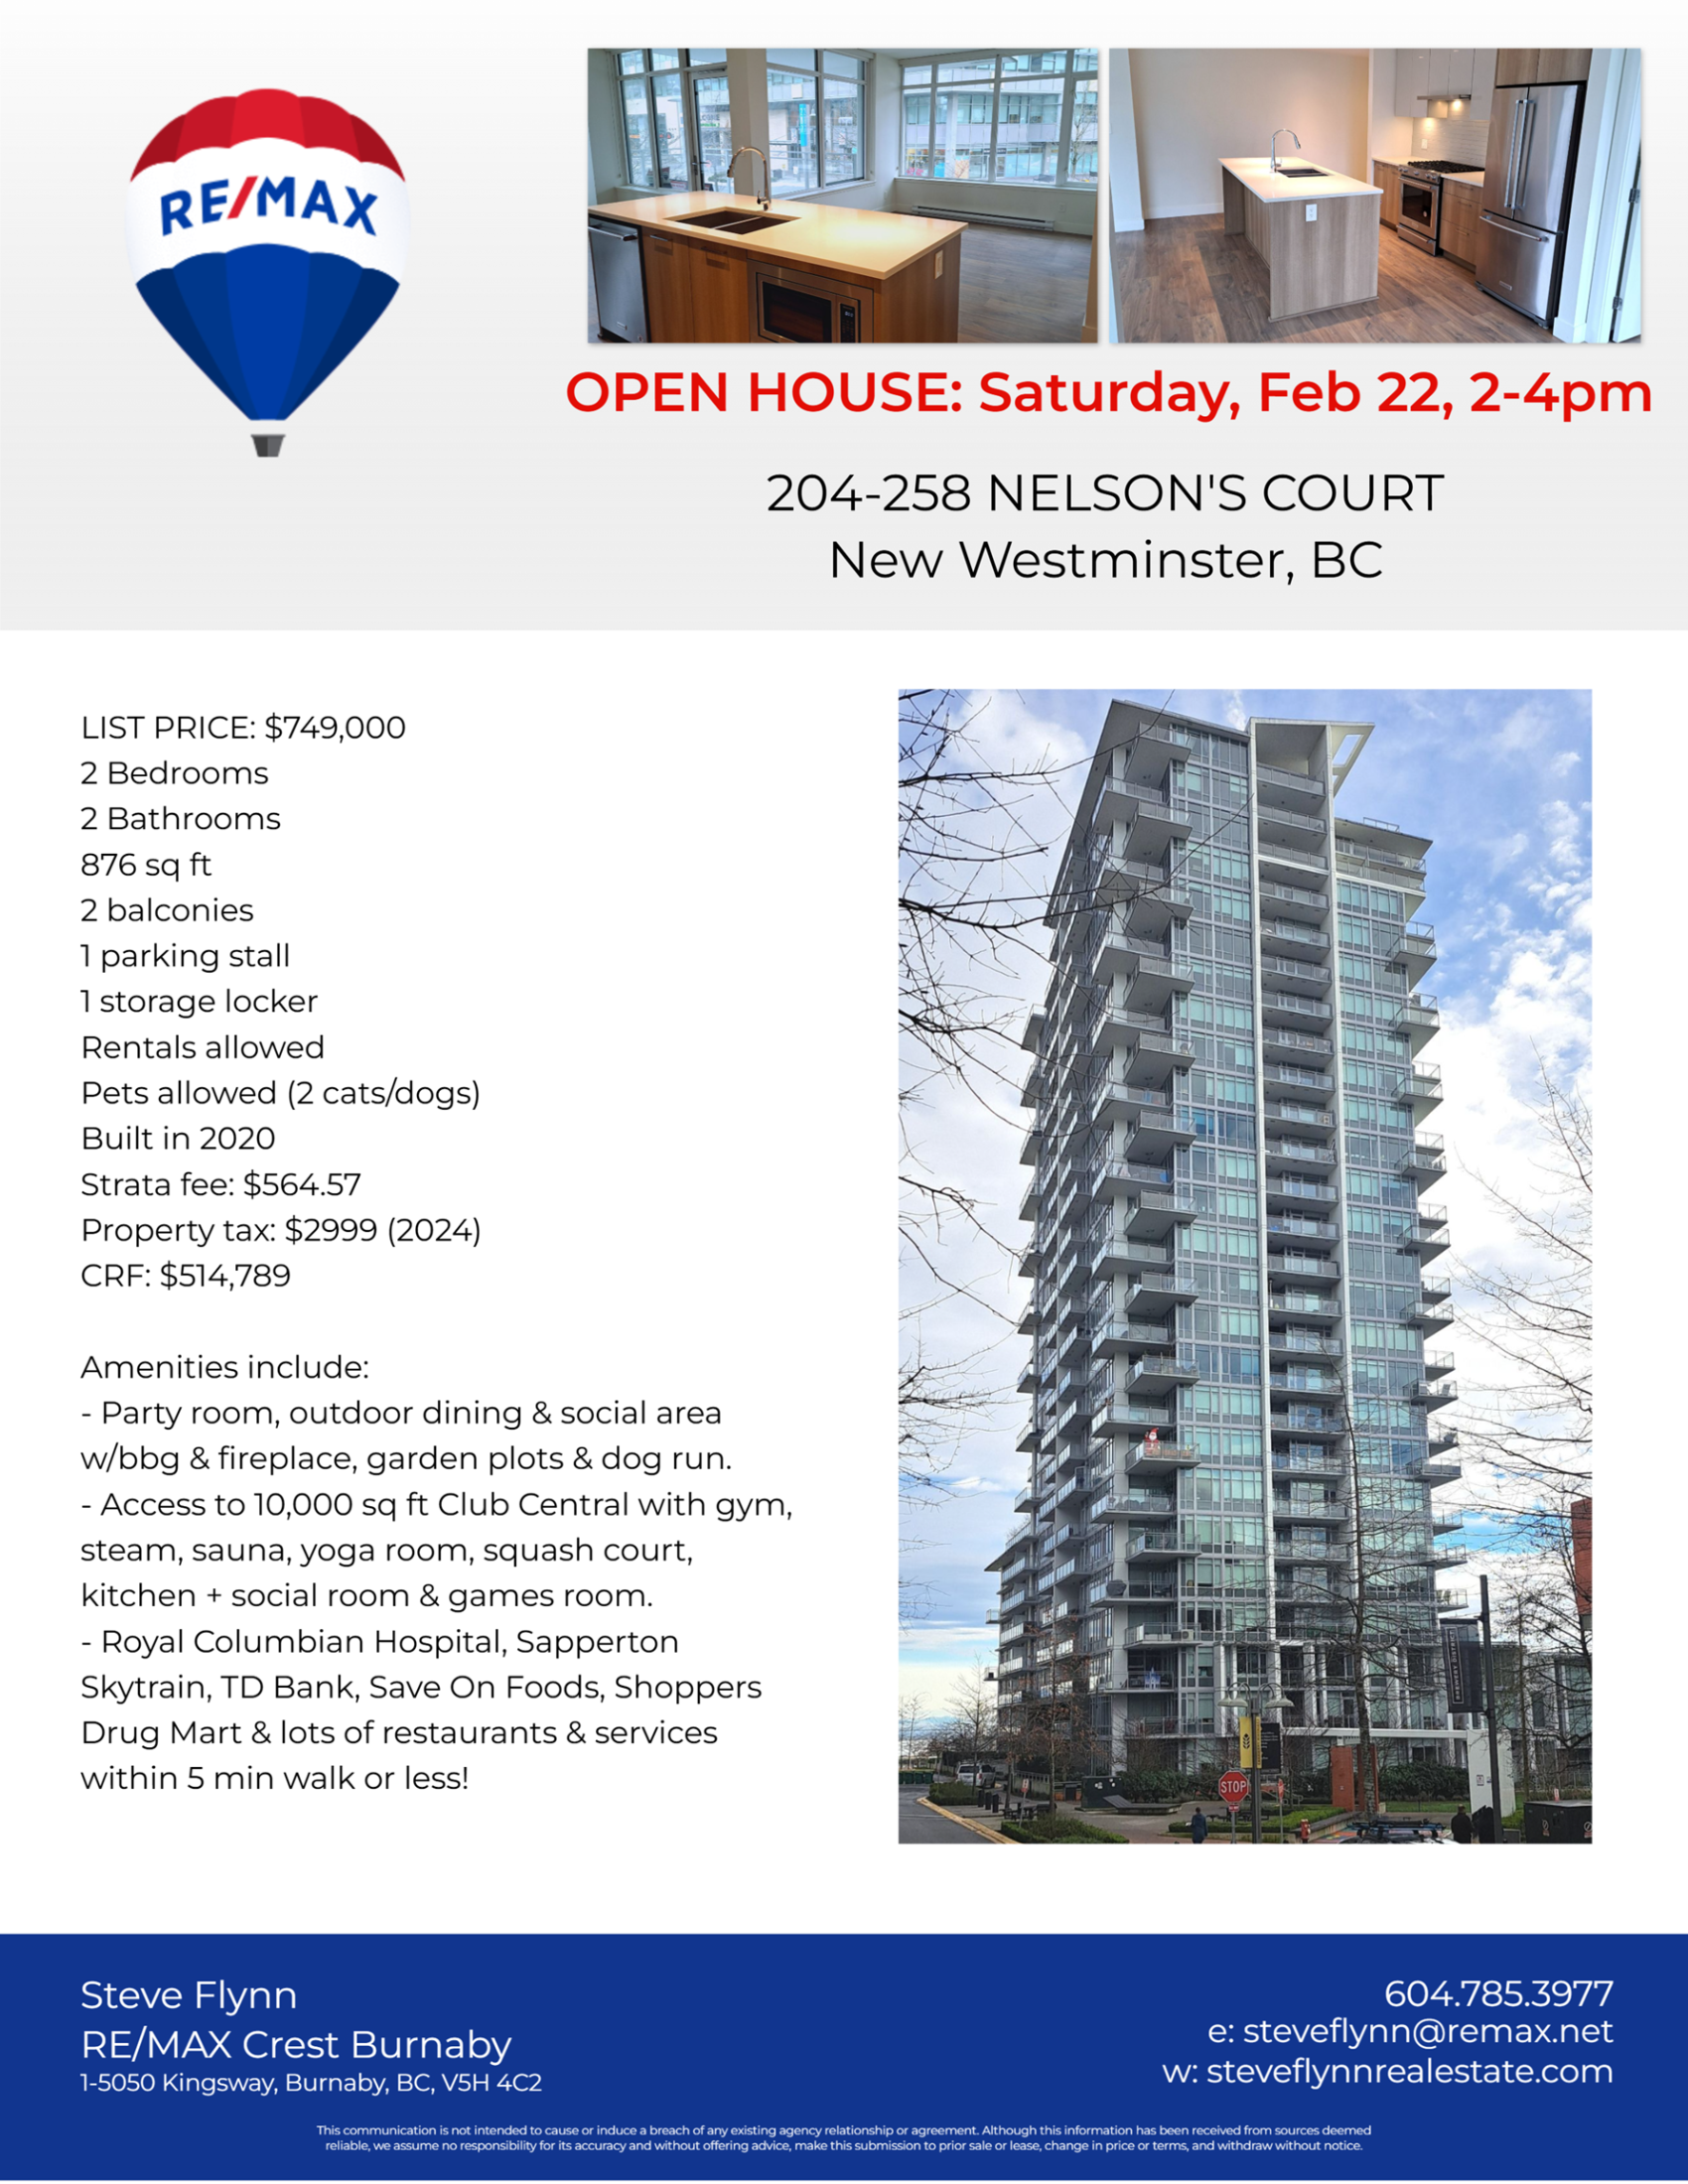
Listed at $749,000 MODERN & sleek, 876 s.f, 2 bed/2 bath condo in New West's dynamic Brewery District neighbourhood. OPEN & bright concept w/stylish kitchen, dining & living room. Kitchen has LUXURY features: s/s appliances, quartz countertops & gas stove. Both bedrooms are decent-sized. 2 balconies, totaling approx 200 s.f. Excellent building amenities incl: party room, outdoor kitchen/bbq & dining area, dog park & dog wash, community garden plots + access to amazing Club Central w/gym, squash, sauna, steam, social kitchen + games room. 2 PETS & RENTALS allowed! 1 parking, 1 locker. Within 5 min walk: Sapperton Skytrain, Royal Columbian Hospital, Save-On Foods, Shoppers, TD Bank & lots of restaurants. This is urban living at its best!
Posted on
March 13, 2025
by
Steve Flynn
The Bank of Canada lowered its overnight policy rate by 25 basis points this morning from 3 per cent to 2.75 per cent. In the statement accompanying the decision, the Bank noted that trade tensions will slow momentum from robust GDP growth observed in the second half of 2024, though how much the economy might slow is complicated by the uncertainty from a rapidly evolving policy landscape. On inflation, the Bank expects prices to rise slightly above their 2 per cent target as the GST tax break ends and forecasts that core inflation will remain above 2 per cent due to persistently elevated shelter costs.
Thanks to tariffs, the Bank of Canada is faced with heightened uncertainty and an economy that may be set to slow down rather than speed up as was expected just a few months ago. With inflation running at near its 2 per cent target and a labour market that appears to have stalled last month, along with falling population growth, there is a strong argument for policy rates to be even lower, though such a path is complicated by the inflationary impact of retaliatory Canadian tariffs. Indeed, the Bank used its statement to caution that monetary policy cannot offset the impacts of a trade war and that it can and must ensure that higher prices do not lead to ongoing inflation. Given that caution, future cuts to the Banks policy rate will be highly dependent on the evolution of inflation and inflation expectations. Copyright British Columbia Real Estate Association. Reprinted with permission.
Posted on
March 13, 2025
by
Steve Flynn
Please visit our Open House at 204 258 NELSON'S CRT in New Westminster. Open House on Saturday, March 15, 2025 2:00PM - 4:00PM MODERN & sleek, 876 s.f, 2 bed/2 bath condo in New West's dynamic Brewery District neighbourhood. OPEN & bright concept w/stylish kitchen, dining & living room. Kitchen has LUXURY features: s/s appliances, quartz countertops & gas stove. Both bedrooms are decent-sized. 2 balconies, totaling approx 200 s.f. Excellent building amenities incl: party room, outdoor kitchen/bbq & dining area, dog park & dog wash, community garden plots + access to amazing Club Central w/gym, squash, sauna, steam, social kitchen + games room. 2 PETS & RENTALS allowed! 1 parking, 1 locker. Within 5 min walk: Sapperton Skytrain, Royal Columbian Hospital, Save-On Foods, Shoppers, TD Bank & lots of restaurants. This is urban living at its best! OPEN HOUSE: Sat. Mar 15, 2-4pm.
Posted on
March 11, 2025
by
Steve Flynn
Vancouver, BC – March 11, 2025. The British Columbia Real Estate Association (BCREA) reports that 4,947 residential unit sales were recorded in Multiple Listing Service® (MLS®) Systems in February 2025, down 9.7 per cent from February 2024. The average MLS® residential price in BC in February 2025 was down 2.4 per cent at $964,349 compared to $987,811 in February 2024. The total sales dollar volume was $4.8 billion, an 11.8 per cent decrease from the same time the previous year. BC MLS® unit sales were 28 per cent lower than the ten-year February average.
“After several months of growing momentum, market activity was hampered in February by the uncertainty surrounding tariffs,” said BCREA Chief Economist Brendon Ogmundson. “Apprehension from prospective buyers will continue amidst this unfortunate trade war but may be somewhat tempered by lower interest rates on the horizon.
Year-to-date, BC residential sales dollar volume is down 4.5 per cent to $8.8 billion, compared with the same period in 2024. Residential unit sales are down 2.8 per cent year-over-year at 9,175 units, while the average MLS® residential price is also down 1.8 per cent to $958,366. Copyright British Columbia Real Estate Association. Reprinted with permission.
Posted on
March 9, 2025
by
Steve Flynn
Listed at $749,000 MODERN & sleek, 876 s.f, 2 bed/2 bath condo in New West's dynamic Brewery District neighbourhood. OPEN & bright concept w/stylish kitchen, dining & living room. Kitchen has LUXURY features: s/s appliances, quartz countertops & gas stove. Both bedrooms are decent-sized. 2 balconies, totaling approx 200 s.f. Excellent building amenities incl: party room, outdoor kitchen/bbq & dining area, dog park & dog wash, community garden plots + access to amazing Club Central w/gym, squash, sauna, steam, social kitchen + games room. 2 PETS & RENTALS allowed! 1 parking, 1 locker. Within 5 min walk: Sapperton Skytrain, Royal Columbian Hospital, Save-On Foods, Shoppers, TD Bank & lots of restaurants. This is urban living at its best!
Posted on
March 8, 2025
by
Steve Flynn
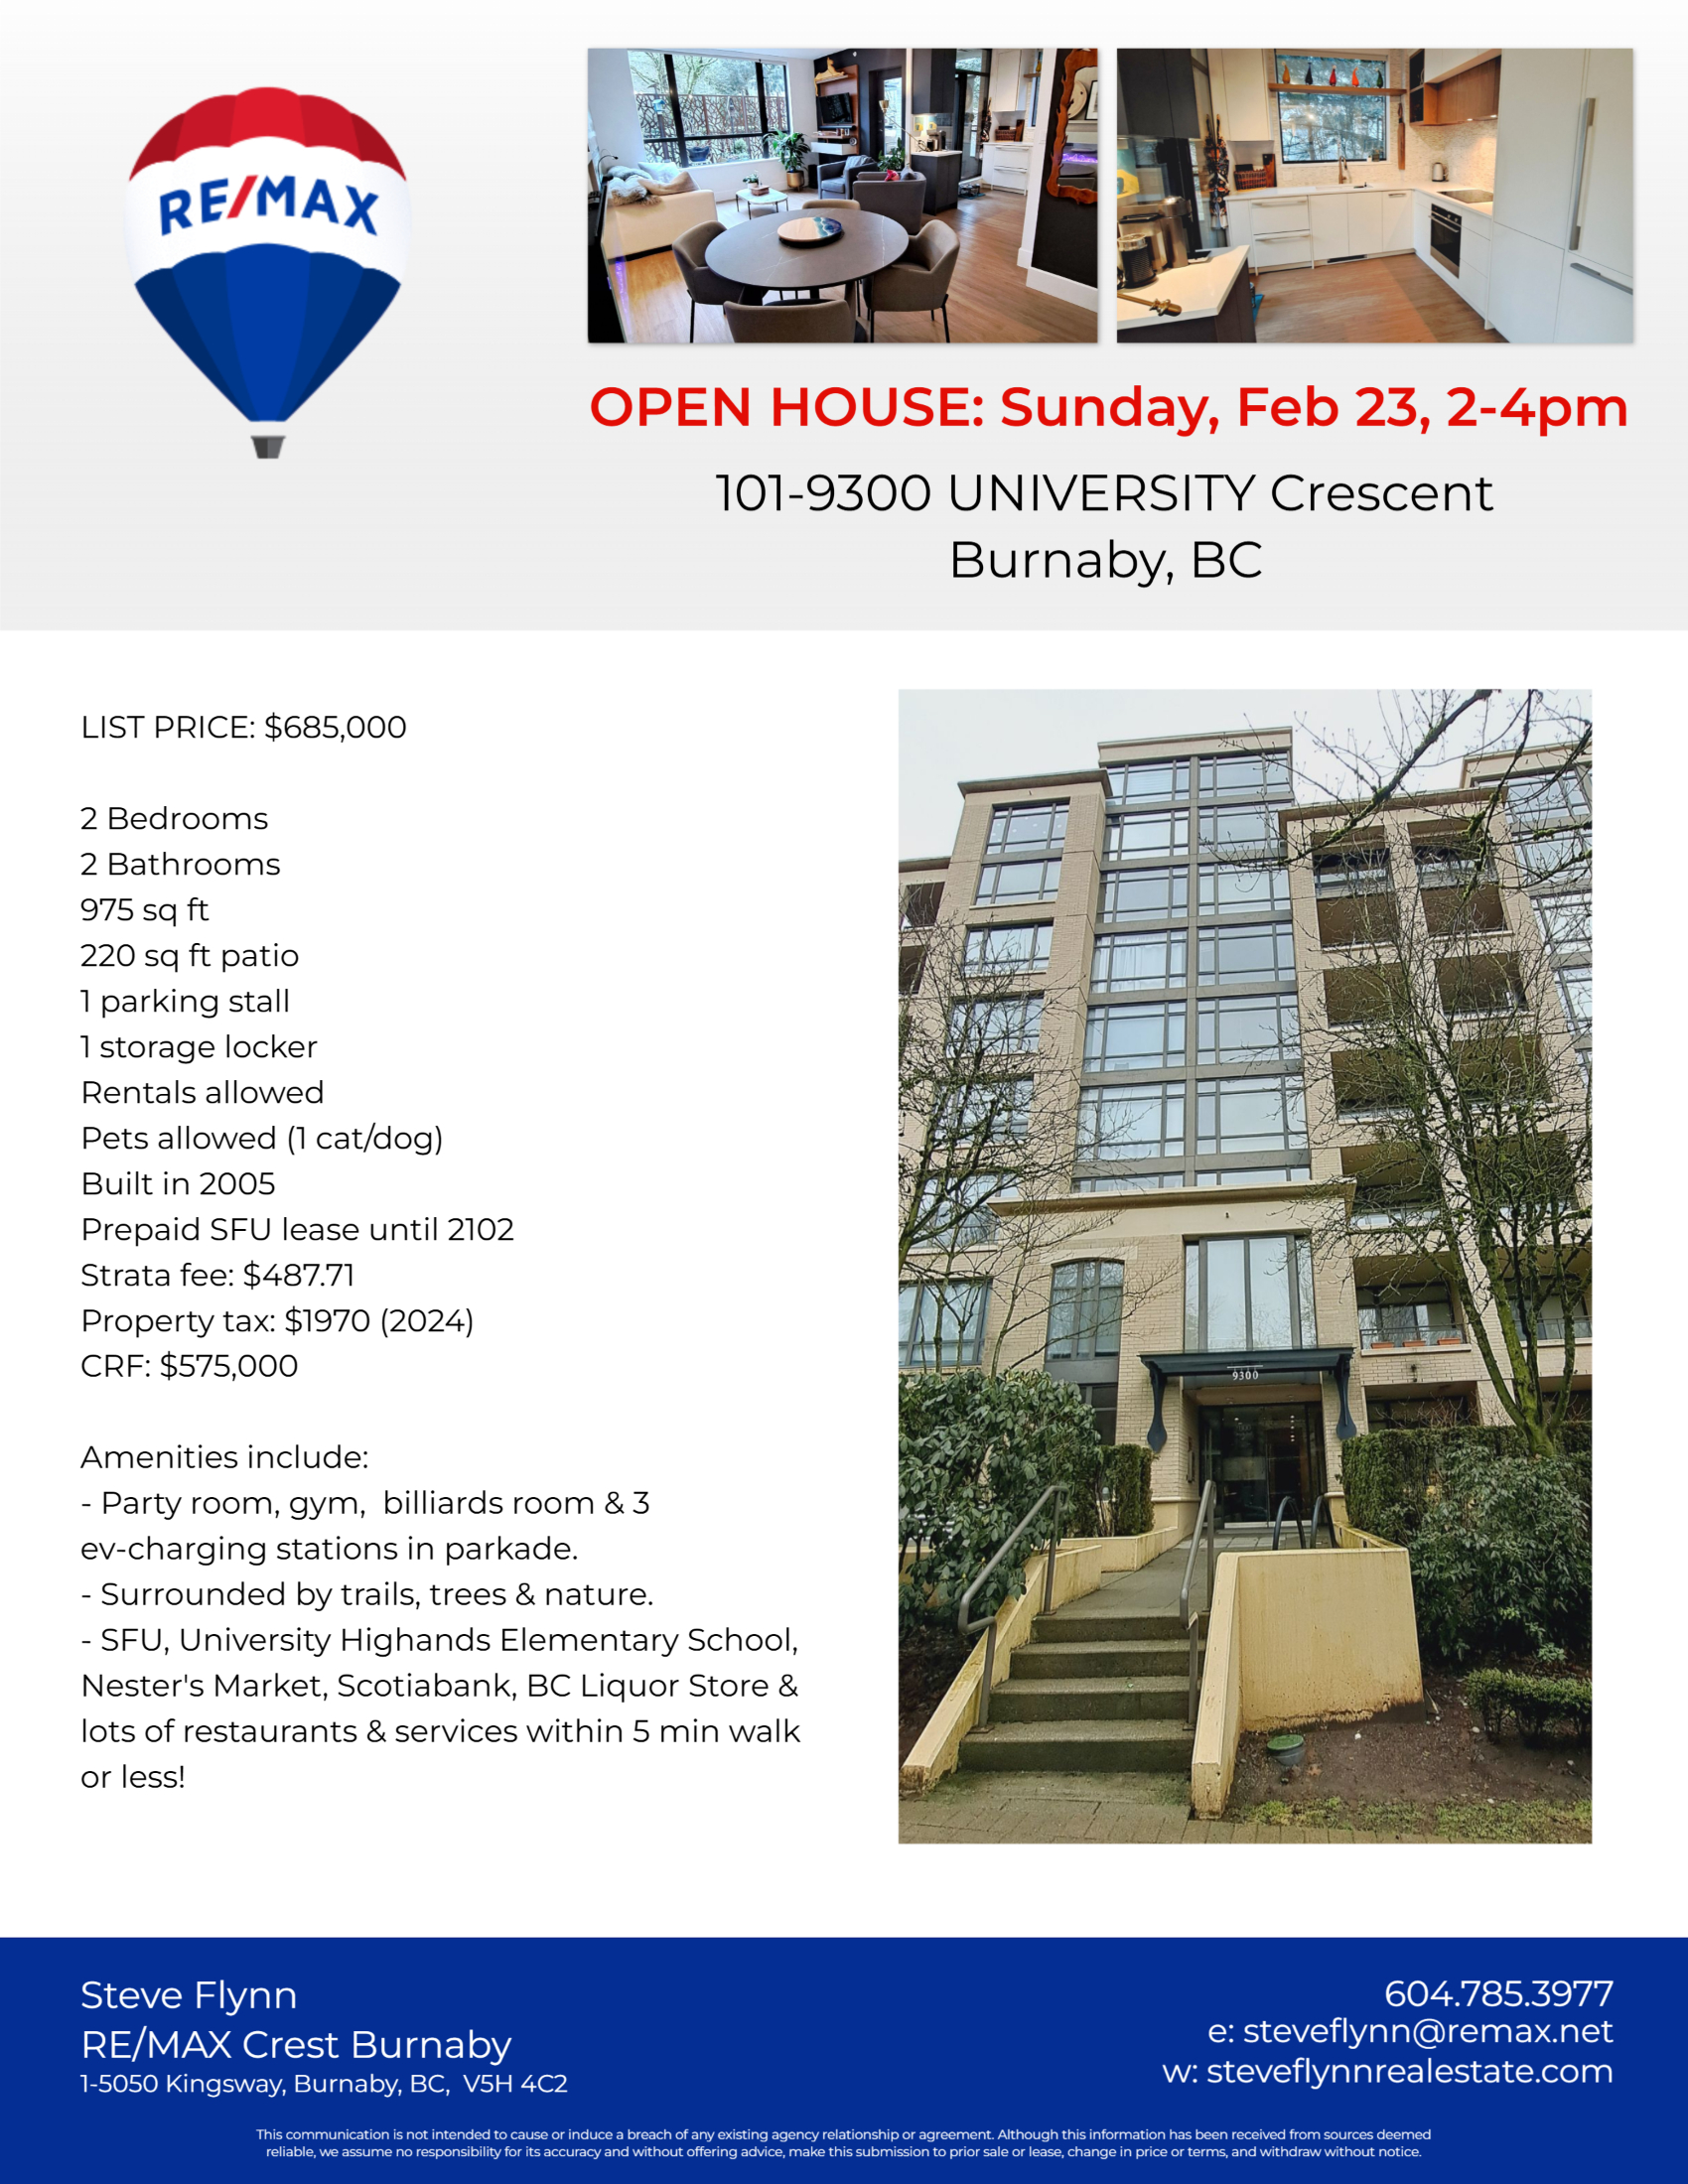
Listed at $685,000 STYLISH & modern, 975 sq ft, 2 bed/2 bath ground floor condo in One University Crescent at SFU. On north-west corner w/lots of windows & breezes. Recently updated w/new flooring, paint, lighting, window coverings, storage, hardware & fixtures throughout + amazing high-end kitchen w/marble finishes, coffee station & Fischer Paykel appliances! The 2 bedrooms are very good-sized & located for ideal privacy. Approx 220 sq ft private deck, perfect for gardeners. Building amenities incl: party room, billiards room, gym & ev-charging in parkade. 1 parking, 1 locker. 1 pet & rentals allowed. Prepaid SFU lease, expires 2102. Surrounded by trails & nature yet SFU, University Highands Elementary, Nester's Market, Scotiabank & many services & dining are within 3 blocks.
Posted on
March 6, 2025
by
Steve Flynn
The MLS® Home Price Index composite benchmark price for all residential properties in Metro Vancouver* is $1,169,100. This represents a 1.1 per cent decrease over February 2024 and a 0.3 per cent decrease compared to January 2025. Specifically: - The benchmark price for detached homes increased 1.8% from Feb 2024 and is unchanged from Jan 2025. - The benchmark price for townhouses/attached decreased 1.2% from Feb 2024 and decreased 1.7% from Jan 2025. - The benchmark price for apartment/condos decreased 2.8% from Feb 2024 and decreased 0.1% from Jan 2025. *Areas covered by the Real Estate Board of Greater Vancouver include: Burnaby, Coquitlam, Maple Ridge, New Westminster, North Vancouver, Pitt Meadows, Port Coquitlam, Port Moody, Richmond, South Delta, Squamish, Sunshine Coast, Vancouver, West Vancouver, and Whistler.
Posted on
March 6, 2025
by
Steve Flynn
Please visit our Open House at 204 258 NELSON'S CRT in New Westminster. Open House on Sunday, March 9, 2025 2:00PM - 4:00PM MODERN & sleek, 876 s.f, 2 bed/2 bath condo in New West's dynamic Brewery District neighbourhood. OPEN & bright concept w/stylish kitchen, dining & living room. Kitchen has LUXURY features: s/s appliances, quartz countertops & gas stove. Both bedrooms are decent-sized. 2 balconies, totaling approx 200 s.f. Excellent building amenities incl: party room, outdoor kitchen/bbq & dining area, dog park & dog wash, community garden plots + access to amazing Club Central w/gym, squash, sauna, steam, social kitchen + games room. 2 PETS & RENTALS allowed! 1 parking, 1 locker. Within 5 min walk: Sapperton Skytrain, Royal Columbian Hospital, Save-On Foods, Shoppers, TD Bank & lots of restaurants. This is urban living at its best! OPEN HOUSE: Sun. Mar 9, 2-4pm.
Posted on
March 5, 2025
by
Steve Flynn
Please visit our Open House at 101 9300 UNIVERSITY CRES in Burnaby. Open House on Saturday, March 8, 2025 2:00PM - 4:00PM STYLISH & modern, 975 sq ft, 2 bed/2 bath ground floor condo in One University Crescent at SFU. On north-west corner w/lots of windows & breezes. Recently updated w/new flooring, paint, lighting, window coverings, storage, hardware & fixtures throughout + amazing high-end kitchen w/marble finishes, coffee station & Fischer Paykel appliances! The 2 bedrooms are very good-sized & located for ideal privacy. Approx 220 sq ft private deck, perfect for gardeners. Building amenities incl: party room, billiards room, gym & ev-charging in parkade. 1 parking, 1 locker. 1 pet & rentals allowed. Prepaid SFU lease, expires 2102. Surrounded by trails & nature yet SFU, University Highands Elementary, Nester's Market, Scotiabank & many services & dining are within 3 blocks. OPEN HOUSE: Sat. Mar 8, 2-4pm.
Posted on
March 4, 2025
by
Steve Flynn
After a 46 per cent year-over-year increase of new listings in January, the number of newly listed properties on the MLS® in Metro Vancouver* rose more moderately in February helping keep market conditions in balanced territory. The Greater Vancouver REALTORS® (GVR) reports that residential sales in the region totalled 1,827 on Metro Vancouver’s Multiple Listing Service® (MLS®) in February 2025, an 11.7 per cent decrease from the 2,070 sales recorded in February 2024. This total was 28.9 per cent below the 10-year seasonal average (2,571). “After the rush of new listings in January, home sales and new listings in February were closer to historical averages, which has positioned the overall market in balanced conditions,” Andrew Lis, GVR’s director of economics and data analytics said. “With a potential Bank of Canada rate cut on the table for mid-March, homebuyers may find slightly improved borrowing conditions while enjoying the largest selection of homes on the market since pre-pandemic times.” There were 5,057 detached, attached and apartment properties newly listed for sale on the MLS® in February 2025. This represents a 10.9 per cent increase compared to the 4,560 properties listed in February 2024. This was 11.6 per cent above the 10-year seasonal average (4,530). The total number of properties currently listed for sale on the MLS® system in Metro Vancouver is 12,744, a 32.3 per cent increase compared to February 2024 (9,634). This is also 36.4 per cent above the 10-year seasonal average (9,341). Across all detached, attached and apartment property types, the sales-to-active listings ratio for February 2025 is 14.8 per cent. By property type, the ratio is 10.7 per cent for detached homes, 18.5 per cent for attached, and 16.8 per cent for apartments. Analysis of the historical data suggests downward pressure on home prices occurs when the ratio dips below 12 per cent for a sustained period, while home prices often experience upward pressure when it surpasses 20 per cent over several months. “Balanced market conditions typically bring a flatter price trajectory, and we’ve seen prices across all segments remain in a holding pattern for the past few months,” Lis said. “But with the active spring season just around the corner, it will be interesting to see whether buyers take advantage of some of the most favorable market conditions seen in years, and whether sellers change their willingness to bring their properties to market.” The MLS® Home Price Index composite benchmark price for all residential properties in Metro Vancouver is currently $1,169,100. This represents a 1.1 per cent decrease over February 2024 and a 0.3 per cent decrease compared to January 2025. Sales of detached homes in February 2025 reached 477, a 14.8 per cent decrease from the 560 detached sales recorded in February 2024. The benchmark price for a detached home is $2,006,100. This represents a 1.8 per cent increase from February 2024 and is virtually unchanged compared to January 2025. Sales of apartment homes reached 976 in February 2025, a 10.6 per cent decrease compared to the 1,092 sales in February 2024. The benchmark price of an apartment home is $747,500. This represents a 2.8 per cent decrease from February 2024 and a 0.1 per cent decrease compared to January 2025. Attached home sales in February 2025 totalled 359, a 10.9 per cent decrease compared to the 403 sales in February 2024. The benchmark price of a townhouse is $1,087,100. This represents a 1.2 per cent decrease from February 2024 and a 1.7 per cent decrease compared to January 2025. *Areas covered by the Real Estate Board of Greater Vancouver include: Burnaby, Coquitlam, Maple Ridge, New Westminster, North Vancouver, Pitt Meadows, Port Coquitlam, Port Moody, Richmond, South Delta, Squamish, Sunshine Coast, Vancouver, West Vancouver, and Whistler.
Posted on
March 3, 2025
by
Steve Flynn
Canadian real GDP rose by 0.2 per cent in December, after declining by 0.2 per cent in November. Goods-producing sectors rose 0.3 per cent, while service-producing industries were up 0.2 per cent. Sectoral growth was led by mining, quarrying, and oil and gas extraction (0.8 per cent), utilities (4.7 per cent), and retail trade (2.6 per cent). Output for the offices of real-estate agents and brokers fell by 6.0 per cent month-over-month. Preliminary estimates suggest that real GDP by industry increased by 0.3 per cent in January.
Real GDP increased by 0.6 per cent in the final quarter of 2024, registering an annualized growth rate of 2.6 per cent. Household spending grew by 1.4 per cent, leading to a 1.0 per cent increase in per capita household expenditures during the fourth quarter. Growth was also driven by strong residential construction (3.9 per cent) and non-residential business investment (0.7 per cent). Canadian trade grew in the fourth quarter, with exports of goods and services (1.8 per cent) outpacing imports (1.3 per cent). Household savings rates fell from 7.3 per cent to 6.1 per cent in the fourth quarter, driven by slower wage and income growth compared to spending, as well as lower investment earnings. On a per capita basis, GDP rose 0.2 per cent in Q4, but fell 1.4 per cent in 2024 overall. Canada's GDP growth in the final quarter reflects the impacts of lower interest rates as well as temporary relief from the GST holiday on household consumption. This comes in the context of inflation moderating to its target range, with price appreciation being largely driven by high shelter costs. In addition, uncertainty surrounding potential tariffs and their inflationary impacts continue to hamper our economic outlook. This report, although stronger than expected, likely will not sway the Bank in either direction particularly as the impact of likely tariffs takes center stage before the next Bank of Canada interest rate decision. Copyright British Columbia Real Estate Association. Reprinted with permission.
Posted on
March 2, 2025
by
Steve Flynn
Listed at $685,000 STYLISH & modern, 975 sq ft, 2 bed/2 bath ground floor condo in One University Crescent at SFU. On north-west corner w/lots of windows & breezes. Recently updated w/new flooring, paint, lighting, window coverings, storage, hardware & fixtures throughout + amazing high-end kitchen w/marble finishes, coffee station & Fischer Paykel appliances! The 2 bedrooms are very good-sized & located for ideal privacy. Approx 220 sq ft private deck, perfect for gardeners. Building amenities incl: party room, billiards room, gym & ev-charging in parkade. 1 parking, 1 locker. 1 pet & rentals allowed. Prepaid SFU lease, expires 2102. Surrounded by trails & nature yet SFU, University Highands Elementary, Nester's Market, Scotiabank & many services & dining are within 3 blocks.
Posted on
March 1, 2025
by
Steve Flynn
Listed at $749,000 MODERN & sleek, 876 s.f, 2 bed/2 bath condo in New West's dynamic Brewery District neighbourhood. OPEN & bright concept w/stylish kitchen, dining & living room. Kitchen has LUXURY features: s/s appliances, quartz countertops & gas stove. Both bedrooms are decent-sized. 2 balconies, totaling approx 200 s.f. Excellent building amenities incl: party room, outdoor kitchen/bbq & dining area, dog park & dog wash, community garden plots + access to amazing Club Central w/gym, squash, sauna, steam, social kitchen + games room. 2 PETS & RENTALS allowed! 1 parking, 1 locker. Within 5 min walk: Sapperton Skytrain, Royal Columbian Hospital, Save-On Foods, Shoppers, TD Bank & lots of restaurants. This is urban living at its best!
Posted on
February 28, 2025
by
Steve Flynn
Please visit our Open House at 101 9300 UNIVERSITY CRES in Burnaby. Open House on Sunday, March 2, 2025 2:00PM - 4:00PM STYLISH & modern, 975 sq ft, 2 bed/2 bath ground floor condo in One University Crescent at SFU. On north-west corner w/lots of windows & breezes. Recently updated w/new flooring, paint, lighting, window coverings, storage, hardware & fixtures throughout + amazing high-end kitchen w/marble finishes, coffee station & Fischer Paykel appliances! The 2 bedrooms are very good-sized & located for ideal privacy. Approx 220 sq ft private deck, perfect for gardeners. Building amenities incl: party room, billiards room, gym & ev-charging in parkade. 1 parking, 1 locker. 1 pet & rentals allowed. Prepaid SFU lease, expires 2102. Surrounded by trails & nature yet SFU, University Highands Elementary, Nester's Market, Scotiabank & many services & dining are within 3 blocks. OPEN HOUSE: Sun. Mar 2, 2-4pm.
Posted on
February 27, 2025
by
Steve Flynn
Please visit our Open House at 204 258 NELSON'S CRT in New Westminster. Open House on Saturday, March 1, 2025 2:00PM - 4:00PM MODERN & sleek, 876 s.f, 2 bed/2 bath condo in New West's dynamic Brewery District neighbourhood. OPEN & bright concept w/stylish kitchen, dining & living room. Kitchen has LUXURY features: s/s appliances, quartz countertops & gas stove. Both bedrooms are decent-sized. 2 balconies, totaling approx 200 s.f. Excellent building amenities incl: party room, outdoor kitchen/bbq & dining area, dog park & dog wash, community garden plots + access to amazing Club Central w/gym, squash, sauna, steam, social kitchen + games room. 2 PETS & RENTALS allowed! 1 parking, 1 locker. Within 5 min walk: Sapperton Skytrain, Royal Columbian Hospital, Save-On Foods, Shoppers, TD Bank & lots of restaurants. This is urban living at its best! OPEN HOUSE: Sat. Mar 1, 2-4pm.
Posted on
February 24, 2025
by
Steve Flynn
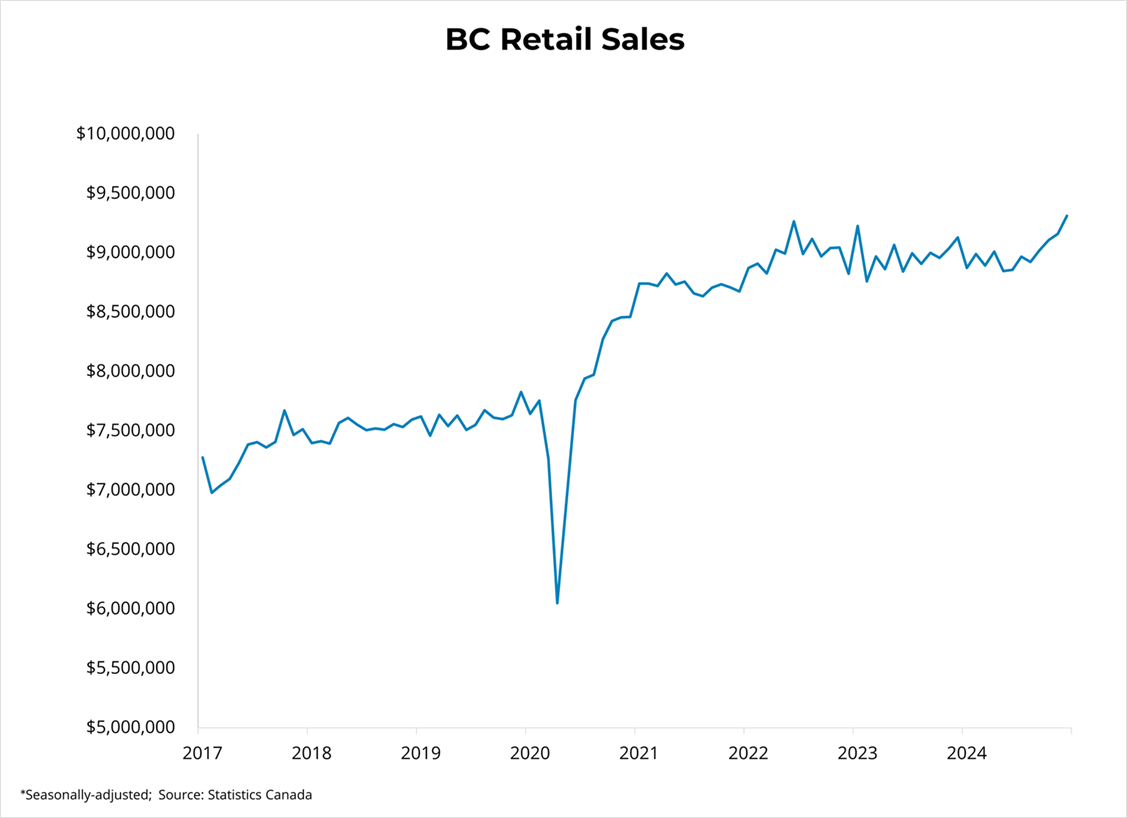
Canadian retail sales increased by 2.5 per cent to $69.6 billion in December from the previous month. Compared to the same time last year, retail sales are up by 3.9 per cent. Furthermore, core retail sales, which exclude gasoline and automobile items, also rose by 2.5 per cent month-over-month. In volume terms, adjusted for rising prices, retail sales increased by 2.5 per cent in December. In the fourth quarter of 2024, retail sales increased by 2.4 per cent, while retail sales rose by 1.3 per cent on an annual basis in 2024.
Retail sales in British Columbia were up 1.6 per cent in December month-over-month and up 2.0 per cent compared to the same time last year. In the CMA of Vancouver, retail sales were up 2.1 per cent both from the prior month and from December 2023.
Canada's sharp jump in retail activity in December largely reflects the impact of the GST/HST tax break during the holiday season. As expected, strength in core retail sales is driven by sales in the food/beverage and clothing industries, both of which were included under the tax holiday. While tailwinds from the tax break were expected, economists are mostly monitoring whether this momentum will continue following its conclusion last week. Nonetheless, the Bank of Canada remains poised for a 25-point cut next month and hopes to see its effects transmit into stronger Canadian retail spending in the first quarter of 2025. Copyright British Columbia Real Estate Association. Reprinted with permission.
Posted on
February 23, 2025
by
Steve Flynn
Listed at $685,000 STYLISH & modern, 975 sq ft, 2 bed/2 bath ground floor condo in One University Crescent at SFU. On north-west corner w/lots of windows & breezes. Recently updated w/new flooring, paint, lighting, window coverings, storage, hardware & fixtures throughout + amazing high-end kitchen w/marble finishes, coffee station & Fischer Paykel appliances! The 2 bedrooms are very good-sized & located for ideal privacy. Approx 220 sq ft private deck, perfect for gardeners. Building amenities incl: party room, billiards room, gym & ev-charging in parkade. 1 parking, 1 locker. 1 pet & rentals allowed. Prepaid SFU lease, expires 2102. Surrounded by trails & nature yet SFU, University Highands Elementary, Nester's Market, Scotiabank & many services & dining are within 3 blocks.
Posted on
February 22, 2025
by
Steve Flynn
Listed at $749,000 MODERN & sleek, 876 s.f, 2 bed/2 bath condo in New West's dynamic Brewery District neighbourhood. OPEN & bright concept w/stylish kitchen, dining & living room. Kitchen has LUXURY features: s/s appliances, quartz countertops & gas stove. Both bedrooms are decent-sized. 2 balconies, totaling approx 200 s.f. Excellent building amenities incl: party room, outdoor kitchen/bbq & dining area, dog park & dog wash, community garden plots + access to amazing Club Central w/gym, squash, sauna, steam, social kitchen + games room. 2 PETS & RENTALS allowed! 1 parking, 1 locker. Within 5 min walk: Sapperton Skytrain, Royal Columbian Hospital, Save-On Foods, Shoppers, TD Bank & lots of restaurants. This is urban living at its best!
Posted on
February 21, 2025
by
Steve Flynn
Please visit our Open House at 101 9300 UNIVERSITY CRES in Burnaby. Open House on Sunday, February 23, 2025 2:00PM - 4:00PM STYLISH & modern, 975 sq ft, 2 bed/2 bath ground floor condo in One University Crescent at SFU. On north-west corner w/lots of windows & breezes. Recently updated w/new flooring, paint, lighting, window coverings, storage, hardware & fixtures throughout + amazing high-end kitchen w/marble finishes, coffee station & Fischer Paykel appliances! The 2 bedrooms are very good-sized & located for ideal privacy. Approx 220 sq ft private deck, perfect for gardeners. Building amenities incl: party room, billiards room, gym & ev-charging in parkade. 1 parking, 1 locker. 1 pet & rentals allowed. Prepaid SFU lease, expires 2102. Surrounded by trails & nature yet SFU, University Highands Elementary, Nester's Market, Scotiabank & many services & dining are within 3 blocks. OPEN HOUSE: Sun. Feb 23, 2-4.
Posted on
February 20, 2025
by
Steve Flynn
STYLISH & modern, 975 sq ft, 2 bed/2 bath ground floor condo in One University Crescent at SFU. On north-west corner w/lots of windows & breezes. Recently updated w/new flooring, paint, lighting, window coverings, storage, hardware & fixtures throughout + amazing high-end kitchen w/marble finishes, coffee station & Fischer Paykel appliances! The 2 bedrooms are very good-sized & located for ideal privacy. Approx 220 sq ft private deck, perfect for gardeners. Building amenities incl: party room, billiards room, gym & ev-charging in parkade. 1 parking, 1 locker. 1 pet & rentals allowed. Prepaid SFU lease, expires 2102. Surrounded by trails & nature yet SFU, University Highands Elementary, Nester's Market, Scotiabank & many services & dining are within 3 blocks.
Categories:
Abbotsford West, Abbotsford Real Estate
|
Bolivar Heights, North Surrey Real Estate
|
Brentwood Park, Burnaby North Real Estate
|
Brighouse, Richmond Real Estate
|
Burnaby
|
Burnaby Real Estate
|
Burnaby South Real Estate
|
Cape Horn, Coquitlam Real Estate
|
Cariboo, Burnaby North Real Estate
|
Central BN, Burnaby North Real Estate
|
Central Coquitlam, Coquitlam
|
Central Coquitlam, Coquitlam Real Estate
|
Champlain Heights, Vancouver East
|
Champlain Heights, Vancouver East Real Estate
|
Cloverdale BC, Cloverdale Real Estate
|
Cloverdale BC, Surrey Real Estate
|
Cloverdale Real Estate
|
Coal Harbour, Vancouver West Real Estate
|
Coaquitlam
|
College Park PM, Port Moody Real Estate
|
Collingwood VE, Vancouver East Real Estate
|
Coquitlam
|
Coquitlam West, Coquitlam Real Estate
|
Downtown NW, New Westminster Real Estate
|
Downtown VW, Vancouver West
|
Downtown VW, Vancouver West Real Estate
|
Eagleridge, Coquitlam Real Estate
|
False Creek North, Vancouver West
|
Fraserview NW, New Westminster
|
Fraserview NW, New Westminster Real Estate
|
Fraserview VE, Vancouver East Real Estate
|
GlenBrooke North, New Westminster Real Estate
|
Grandview Surrey, Surrey Real Estate
|
Harrison Hot Springs Real Estate
|
Hastings, Vancouver East Real Estate
|
Highgate, Burnaby South Real Estate
|
Hockaday, Coquitlam Real Estate
|
January 2014 Sales in Greater Vancouver
|
Metrotown, Burnaby South Real Estate
|
New Horizons, Coquitlam Real Estate
|
New Westminster Real Estate
|
Port Moody
|
Port Moody Real Estate
|
Quay, New Westminster Real Estate
|
Queensborough, New Westminster Real Estate
|
Richmond Real Estate
|
Riverdale RI, Richmond Real Estate
|
Riverwood, Port Coquitlam Real Estate
|
Sapperton, New Westminster Real Estate
|
Simon Fraser Univer., Burnaby North Real Estate
|
Surrey
|
The Heights NW, New Westminster
|
The Heights NW, New Westminster Real Estate
|
Tsawwassen Central, Tsawwassen Real Estate
|
Uptown NW, New Westminster Real Estate
|
Uptown, New Westminster Real Estate
|
Vancouver
|
Vancouver East Real Estate
|
Videocast of January 2014 sales
|
Walnut Grove, Langley Real Estate
|
West Central, Maple Ridge Real Estate
|
West End VW, Vancouver West Real Estate
|
Whalley, North Surrey Real Estate
|
Whalley, Surrey Real Estate
|
Willoughby Heights, Langley Real Estate
|
 Subscribe with RSS Reader