Posted on
February 20, 2025
by
Steve Flynn
I have listed a new property at 101 9300 UNIVERSITY CRES in Burnaby. STYLISH & modern, 975 sq ft, 2 bed/2 bath ground floor condo in One University Crescent at SFU. On north-west corner w/lots of windows & breezes. Recently updated w/new flooring, paint, lighting, window coverings, storage, hardware & fixtures throughout + amazing high-end kitchen w/marble finishes, coffee station & Fischer Paykel appliances! The 2 bedrooms are very good-sized & located for ideal privacy. Approx 220 sq ft private deck, perfect for gardeners. Building amenities incl: party room, billiards room, gym & ev-charging in parkade. 1 parking & 1 locker. 1 pet & rentals allowed. Prepaid SFU lease, expires 2102. Get away from it all on Burnaby Mountain surrounded by trees & trails yet within blocks of SFU, elementary school, shopping, dining, etc. OPEN HOUSE: Sun. Feb 23, 2-4pm.
Posted on
February 20, 2025
by
Steve Flynn
Please visit our Open House at 204 258 NELSON'S CRT in New Westminster. Open House on Saturday, February 22, 2025 2:00PM - 4:00PM MODERN & sleek, 876 s.f, 2 bed/2 bath condo in New West's dynamic Brewery District neighbourhood. OPEN & bright concept w/stylish kitchen, dining & living room. Kitchen has LUXURY features: s/s appliances, quartz countertops & gas stove. Both bedrooms are decent-sized. 2 balconies, totaling approx 200 s.f. Excellent building amenities incl: party room, outdoor kitchen/bbq & dining area, dog park & dog wash, community garden plots + access to amazing Club Central w/gym, squash, sauna, steam, social kitchen + games room. 2 PETS & RENTALS allowed! 1 parking, 1 locker. Within 5 min walk: Sapperton Skytrain, Royal Columbian Hospital, Save-On Foods, Shoppers, TD Bank & lots of restaurants. This is urban living at its best! OPEN HOUSE: Sat. Feb 22, 2-4pm.
Posted on
February 18, 2025
by
Steve Flynn
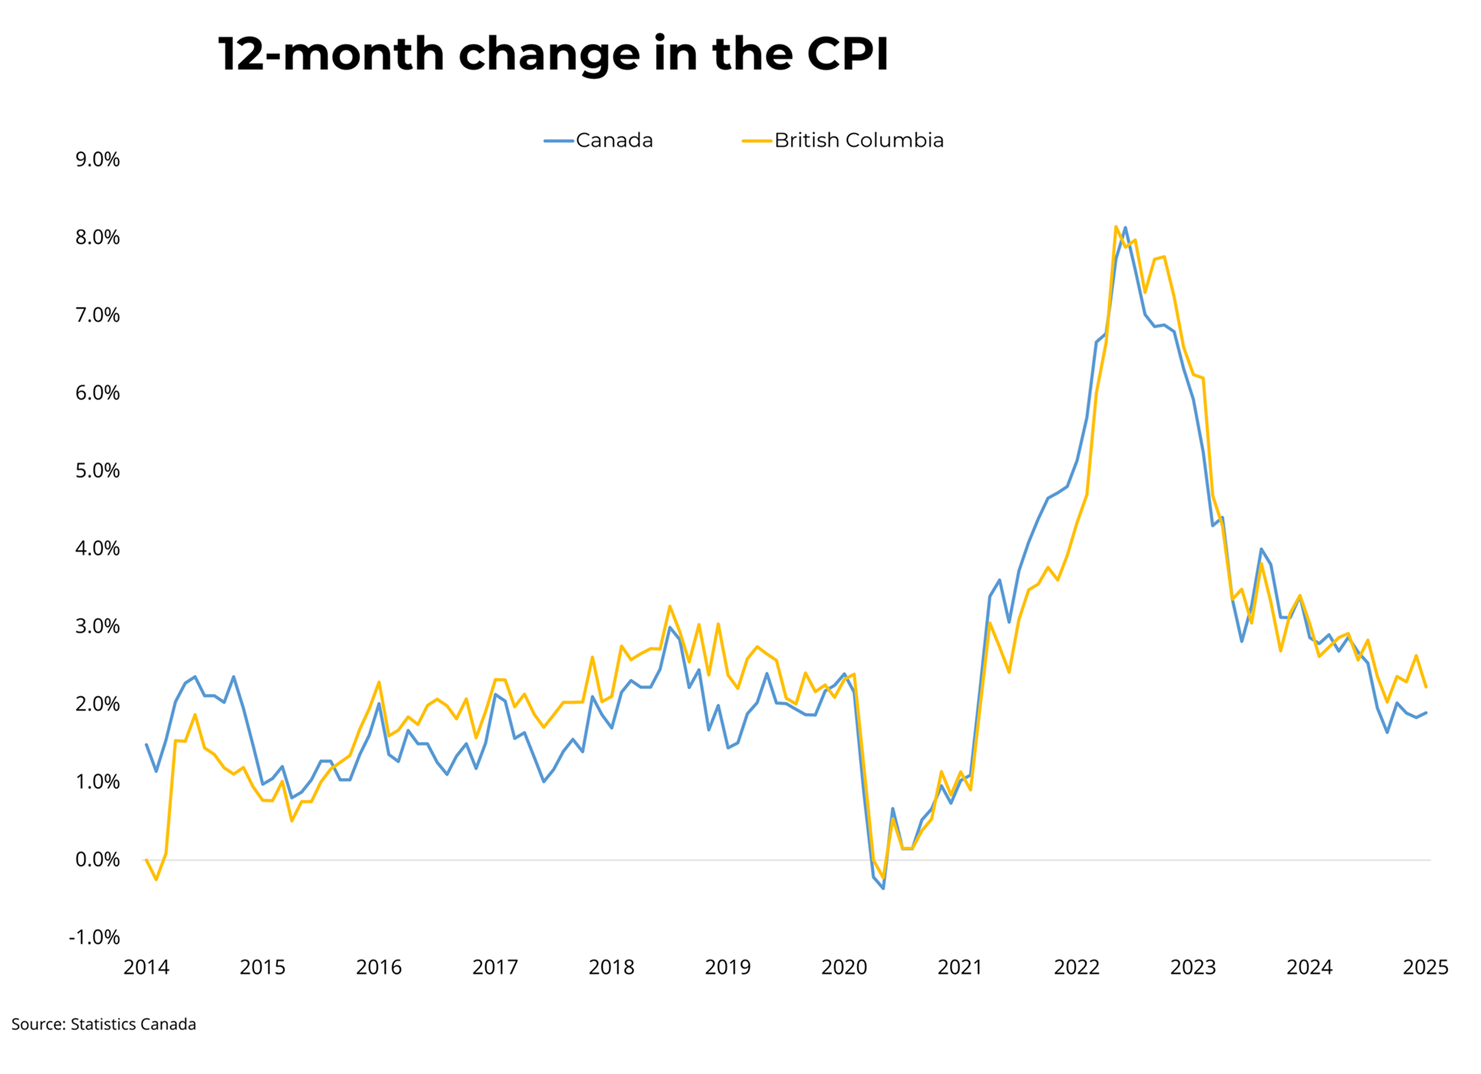
Canadian prices, as measured by the Consumer Price Index (CPI), rose 1.9 per cent on a year-over-year basis in January, up from a 1.8 per cent increase in December. Month-over-month, on a seasonally adjusted basis, CPI increased by 0.1 points in January. Excluding energy, the CPI rose 1.7 per cent in January. Overall, shelter price growth continues to cool, as mortgage interest costs were up 10.2 per cent, marking the seventeenth consecutive month of deceleration. Similarly, rent was up 6.3 per cent in January year-over-year, down from 7.1 per cent in December. In BC, consumer prices rose 2.2 per cent year-over-year, down from 2.6 per cent in December. The Bank of Canada's preferred measures of median and trimmed inflation, which strip out volatile components, both rose to 2.7 per cent year-over-year.
Inflation continues to hold close to target as a rise in energy prices has been offset by price reductions in many goods affected by the GST/HST tax break. However, January saw slight increases in the Bank's core measures, indicating some lingering upward momentum on a quarterly basis. Nonetheless, this report is unlikely to sway the Bank of Canada away from its plan to cut the overnight rate by 25 basis points during their next meeting. Copyright British Columbia Real Estate Association. Reprinted with permission.
Posted on
February 16, 2025
by
Steve Flynn
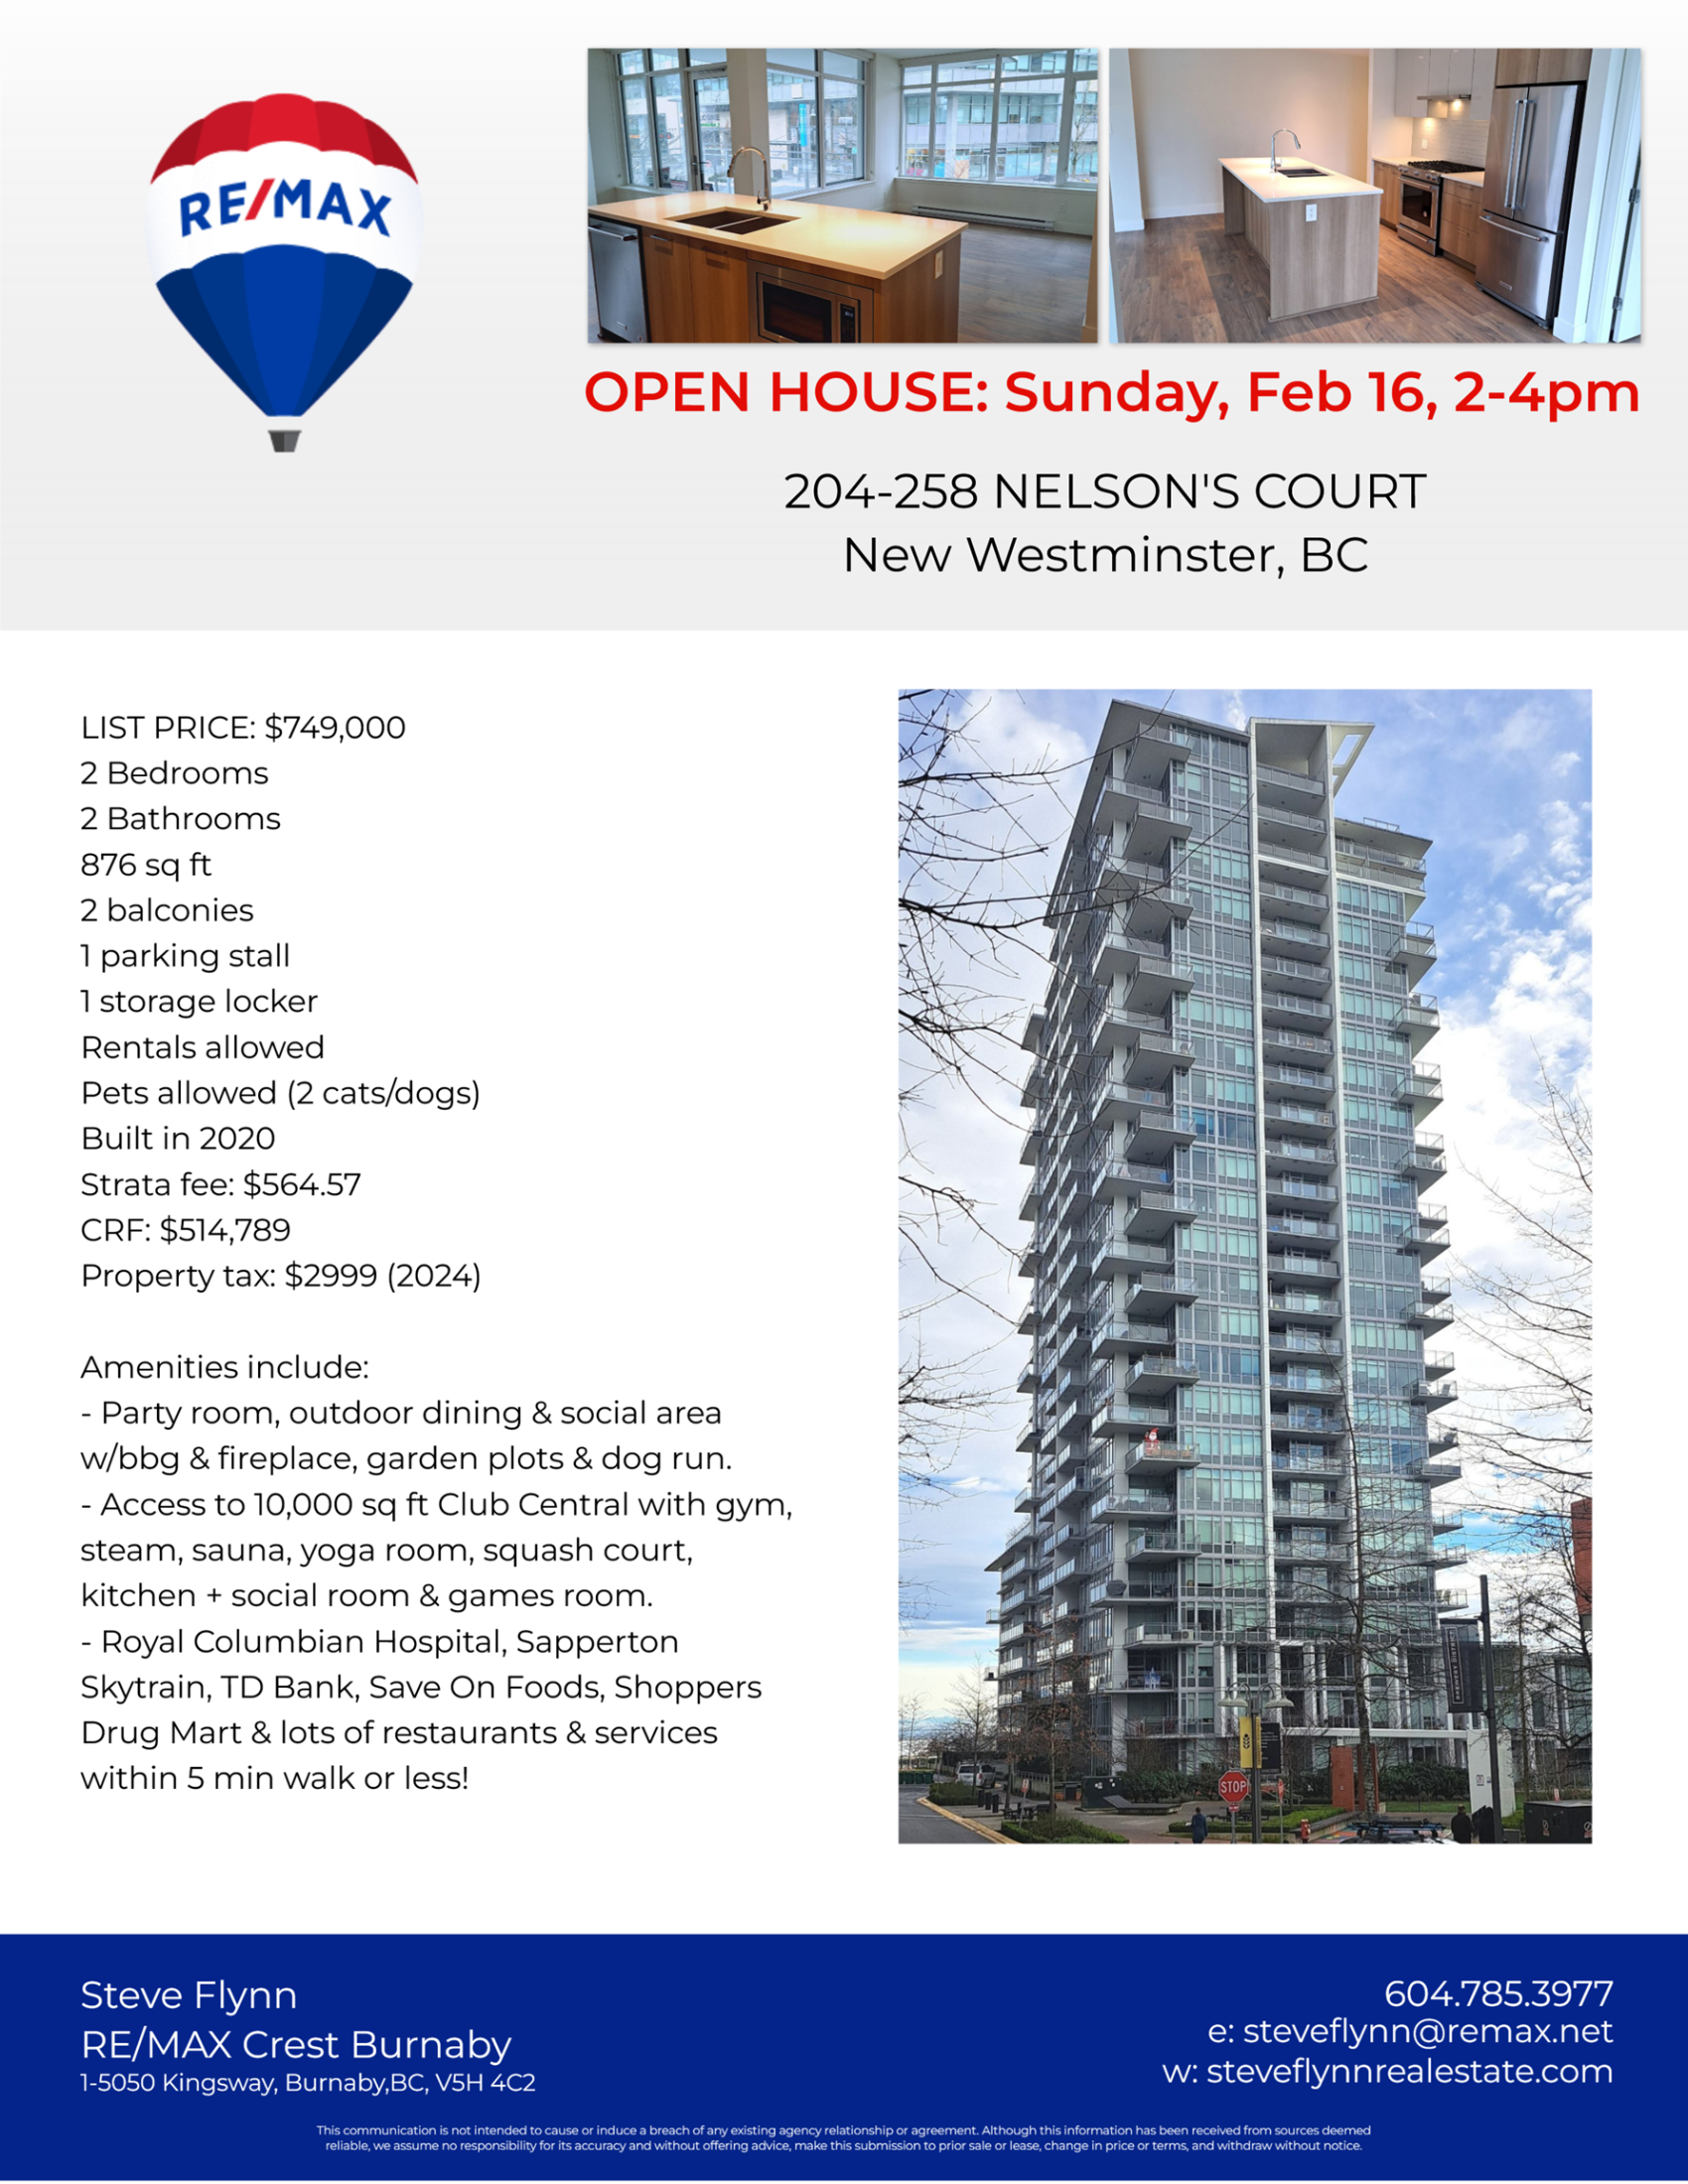
Listed at $749,000. MODERN & sleek, 876 s.f, 2 bed/2 bath condo in New West's dynamic Brewery District neighbourhood. OPEN & bright concept w/stylish kitchen, dining & living room. Kitchen has LUXURY features: s/s appliances, quartz countertops & gas stove. Both bedrooms are decent-sized. 2 balconies, totaling approx 200 s.f. Excellent building amenities incl: party room, outdoor kitchen/bbq & dining area, dog park & dog wash, community garden plots + access to amazing Club Central w/gym, squash, sauna, steam, social kitchen + games room. 2 PETS & RENTALS allowed! 1 parking, 1 locker. Within 5 min walk: Sapperton Skytrain, Royal Columbian Hospital, Save-On Foods, Shoppers, TD Bank & lots of restaurants. This is urban living at its best!
Posted on
February 14, 2025
by
Steve Flynn
Please visit our Open House at 204 258 NELSON'S CRT in New Westminster. Open House on Sunday, February 16, 2025 2:00PM - 4:00PM MODERN & sleek, 876 s.f, 2 bed/2 bath condo in New West's dynamic Brewery District neighbourhood. OPEN & bright concept w/stylish kitchen, dining & living room. Kitchen has LUXURY features: s/s appliances, quartz countertops & gas stove. Both bedrooms are decent-sized. 2 balconies, totaling approx 200 s.f. Excellent building amenities incl: party room, outdoor kitchen/bbq & dining area, dog park & dog wash, community garden plots + access to amazing Club Central w/gym, squash, sauna, steam, social kitchen + games room. 2 PETS & RENTALS allowed! 1 parking, 1 locker. Within 5 min walk: Sapperton Skytrain, Royal Columbian Hospital, Save-On Foods, Shoppers, TD Bank & lots of restaurants. This is urban living at its best! OPEN HOUSE: Sun. Feb 16, 2-4pm.
Posted on
February 13, 2025
by
Steve Flynn
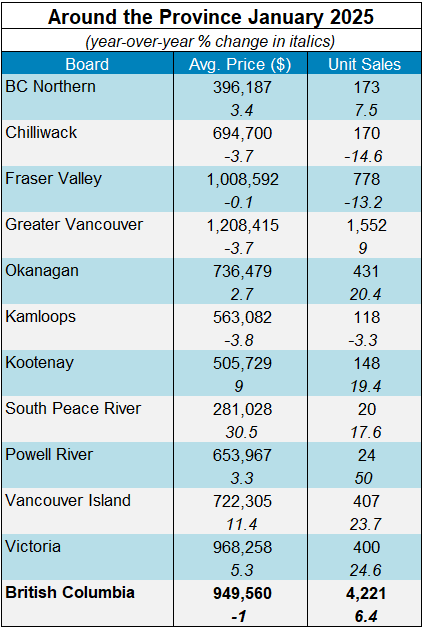
The British Columbia Real Estate Association (BCREA) reports that 4,221 residential unit sales were recorded in Multiple Listing Service® (MLS®) Systems in January 2025, up 6.4 per cent from January 2024. The average MLS® residential price in BC in January 2025 was down 1.0 per cent at $949,560 compared to $959,191 in January 2024. The total sales dollar volume was $4 billion, a 5.3 per cent increase from the same time the previous year. BC MLS® unit sales were 12 per cent lower than the ten-year January average.
“As expected, 2025 is off to a better start in most regions across BC,” said BCREA Chief Economist Brendon Ogmundson. “January’s pickup in sales and listings may foreshadow a stronger 2025, caveated by global uncertainties which may trigger higher or lower rates from the Bank of Canada.”
Active listings in January 2025 climbed to 30,896 units, a 27 per cent increase from the same month last year. Normalizing trends in new listings, coupled with stronger sales activity in the past few months, have led to an accumulation of inventory. Moving forward, it remains crucial for supply to keep pace with growing demand to keep markets balanced and prevent rampant price appreciation. Copyright British Columbia Real Estate Association. Reprinted with permission.
Posted on
February 12, 2025
by
Steve Flynn
The MLS® Home Price Index composite benchmark price for all residential properties in Metro Vancouver* is $1,173,000. This represents a 0.5 per cent increase over January 2024 and a 0.1 per cent increase compared to December 2024. Specifically: - The benchmark price for detached homes increased 3.1% from Jan 2024 and is increased 0.4% from Dec 2024. - The benchmark price for townhouses/attached increased 2.7% from Jan 2024 and decreased 0.8% from Dec 2024. - The benchmark price for apartment/condos decreased 1.7% from Jan 2024 and decreased 0.2% from Dec 2024. *Areas covered by the Real Estate Board of Greater Vancouver include: Burnaby, Coquitlam, Maple Ridge, New Westminster, North Vancouver, Pitt Meadows, Port Coquitlam, Port Moody, Richmond, South Delta, Squamish, Sunshine Coast, Vancouver, West Vancouver, and Whistler.
Posted on
February 11, 2025
by
Steve Flynn
Homes newly listed on the MLS® in Metro Vancouver* rose 46 per cent year-over-year in January, as sellers appear eager to enter the market to start the year: The Greater Vancouver REALTORS® (GVR) reports that residential sales in the region totalled 1,552 in January 2025, an 8.8 per cent increase from the 1,427 sales recorded in January 2024. This was 11.3 per cent below the 10-year seasonal average (1,749). “In the three months preceding January, we’ve watched buyer demand gain momentum, but it appears that momentum is now shifting toward sellers to start the new year,” Andrew Lis, GVR’s director of economics and data analytics said. “Even with this increase in new listing activity, sales continue to outpace last years’ figures, signaling some buyer appetite remains after the upswing that finished off 2024.” There were 5,566 detached, attached and apartment properties newly listed for sale on the Multiple Listing Service® (MLS®) in Metro Vancouver in January 2025. This represents a 46.9 per cent increase compared to the 3,788 properties listed in January 2024. This was 31.1 per cent above the 10-year seasonal average (4,247). The total number of properties currently listed for sale on the MLS® system in Metro Vancouver is 11,494, a 33.1 per cent increase compared to January 2024 (8,633). This is 33.2 per cent above the 10-year seasonal average (8,632). Across all detached, attached and apartment property types, the sales-to-active listings ratio for January 2025 is 14.1 per cent. By property type, the ratio is 9.2 per cent for detached homes, 18.5 per cent for attached, and 16.5 per cent for apartments. Analysis of the historical data suggests downward pressure on home prices occurs when the ratio dips below 12 per cent for a sustained period, while home prices often experience upward pressure when it surpasses 20 per cent over several months. “With new listings outpacing demand to start 2025, price trends saw little fluctuation in January across all segments, with the market overall standing in balanced conditions,” Lis said. “Our 2025 forecast calls for moderate price growth by the end of the year, but we have cautioned that shocks to the economy such as those currently threatening Canada via tariffs from the US could impact these estimates. Going forward, whether these tariffs actually come into force, the duration they remain in place, and the degree to which Canada retaliates will determine the impact to the housing market in our region in the months ahead, if any.” The MLS® Home Price Index composite benchmark price for all residential properties in Metro Vancouver is currently $1,173,000. This represents a 0.5 per cent increase over January 2024 and a 0.1 per cent increase compared to December 2024. Sales of detached homes in January 2025 reached 380, a 0.3 per cent increase from the 379 detached sales recorded in January 2024. The benchmark price for a detached home is $2,005,400. This represents a 3.1 per cent increase from January 2024 and a 0.4 per cent increase compared to December 2024. Sales of apartment homes reached 846 in January 2025, a 13.4 per cent increase compared to the 746 sales in January 2024. The benchmark price of an apartment home is $748,100. This represents a 1.7 per cent decrease from January 2024 and a 0.2 per cent decrease compared to December 2024. Attached home sales in January 2025 totalled 321, a 12.6 per cent increase compared to the 285 sales in January 2024. The benchmark price of a townhouse is $1,105,600. This represents a 2.7 per cent increase from January 2024 and a 0.8 per cent decrease compared to December 2024. *Areas covered by the Real Estate Board of Greater Vancouver include: Burnaby, Coquitlam, Maple Ridge, New Westminster, North Vancouver, Pitt Meadows, Port Coquitlam, Port Moody, Richmond, South Delta, Squamish, Sunshine Coast, Vancouver, West Vancouver, and Whistler.
Posted on
February 9, 2025
by
Steve Flynn
MODERN & sleek, 876 s.f, 2 bed/2 bath condo in New West's dynamic Brewery District neighbourhood. OPEN & bright concept w/stylish kitchen, dining & living room. Kitchen has LUXURY features: s/s appliances, quartz countertops & gas stove. Both bedrooms are decent-sized. 2 balconies, totaling approx 200 s.f. Excellent building amenities incl: party room, outdoor kitchen/bbq & dining area, dog park & dog wash, community garden plots + access to amazing Club Central w/gym, squash, sauna, steam, social kitchen + games room. 2 PETS & RENTALS allowed! 1 parking, 1 locker. Within 5 min walk: Sapperton Skytrain, Royal Columbian Hospital, Save-On Foods, Shoppers, TD Bank & lots of restaurants. This is urban living at its best
Posted on
February 8, 2025
by
Steve Flynn
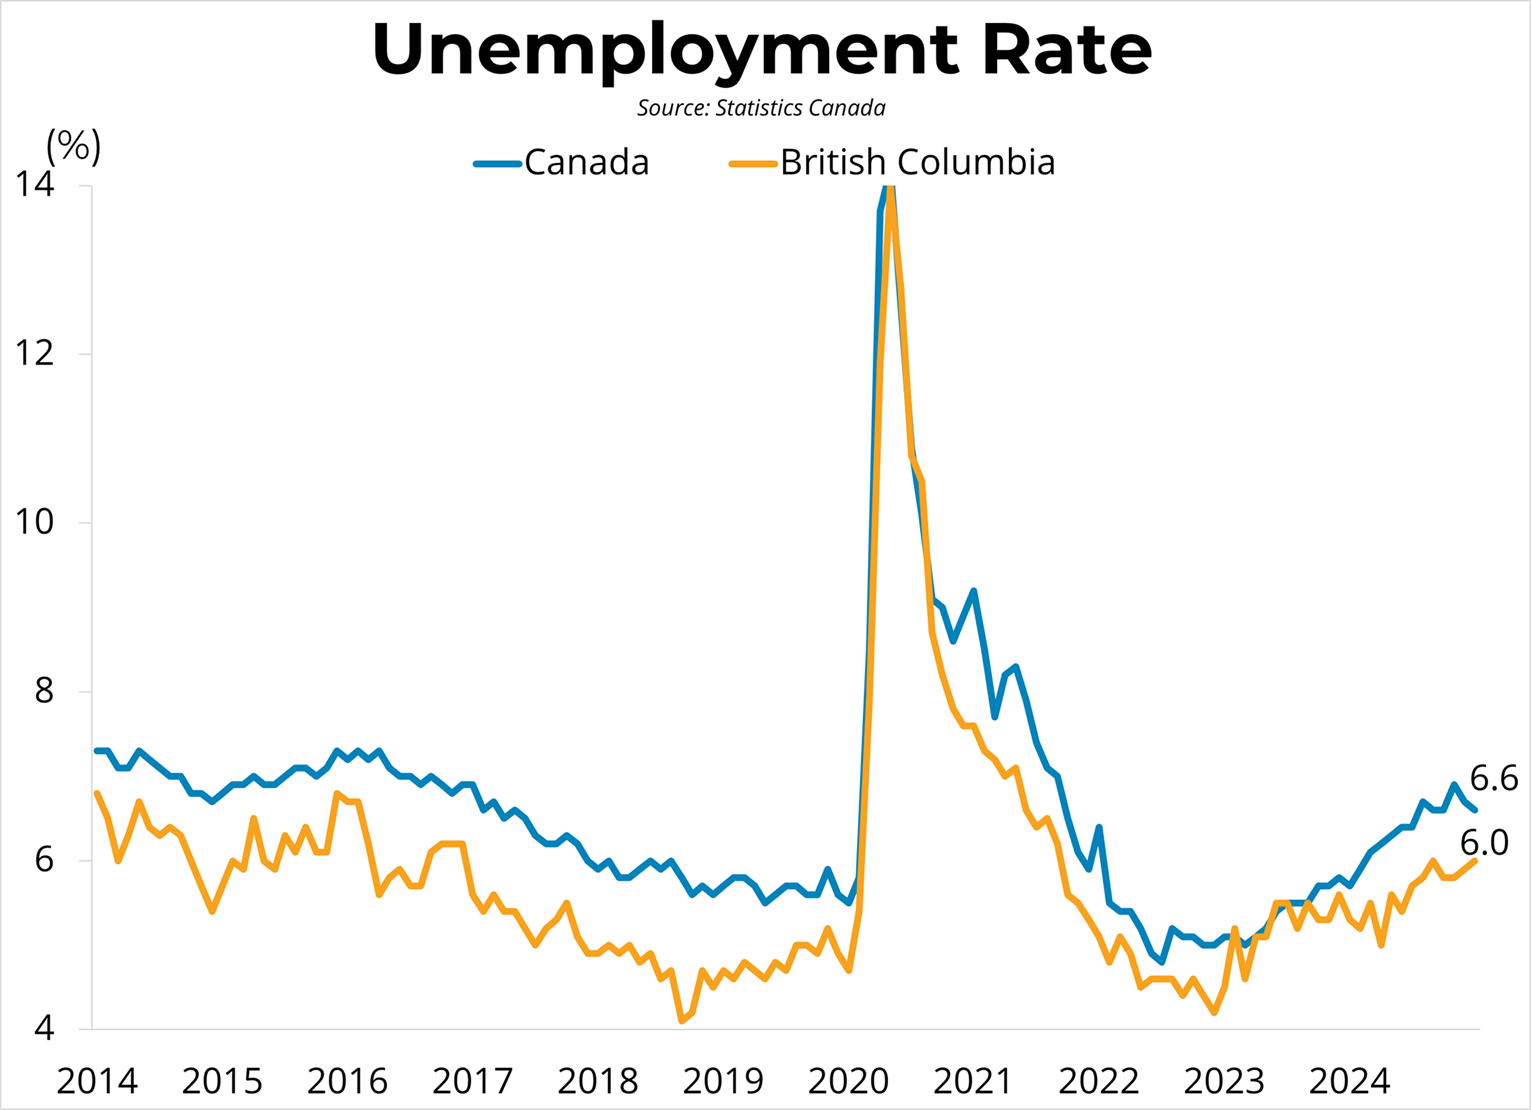
Canadian employment rose by 0.4 per cent from the previous month, growing by 76,000 jobs to 20.993 million in January. The employment rate rose by 0.1 points to 61.1 per cent, while the unemployment rate fell 0.1 points to 6.6 per cent. Average hourly wages rose 3.5 per cent year-over-year to $35.99 last month, while total hours worked were up 2.2 per cent from January of the previous year.
Employment in B.C. rose by 0.8 per cent to 2.944 million, with a gain of 23,000 jobs in January. Employment in Metro Vancouver rose 1.7 per cent to 1.696 million in January. The unemployment rate in B.C. rose by 0.1 points to 6.0 per cent in January. Meanwhile, Vancouver's unemployment rate rose by 0.3 points to 6.8 per cent in the first month of the year.
January's jobs data continues a trend of increasing employment growth and moderation of the unemployment rate, though at a higher-than-desired level. Importantly, private sector job growth has grown in accordance with these trends, with January's numbers being driven by employment gains in manufacturing, construction, and professional, scientific, and technical services, among other industries. January's report begins the year on a strong note and demonstrates an improving labour market. Under the assumption that trade policy remains unchanged, we anticipate that the Bank of Canada will lower its policy rate one more time by 25 basis points in March before pausing to assess the need for further stimulus. Copyright British Columbia Real Estate Association. Reprinted with permission.
Posted on
February 7, 2025
by
Steve Flynn
Please visit our Open House at 204 258 NELSON'S CRT in New Westminster. Open House on Sunday, February 9, 2025 2:00PM - 4:00PM MODERN & sleek, 876 s.f, 2 bed/2 bath condo in New West's dynamic Brewery District neighbourhood. OPEN & bright concept w/stylish kitchen, dining & living room. Kitchen has LUXURY features: s/s appliances, quartz countertops & gas stove. Both bedrooms are decent-sized. 2 balconies, totaling approx 200 s.f. Excellent building amenities incl: party room, outdoor kitchen/bbq & dining area, dog park & dog wash, community garden plots + access to amazing Club Central w/gym, squash, sauna, steam, social kitchen + games room. 2 PETS & RENTALS allowed! 1 parking, 1 locker. Within 5 min walk: Sapperton Skytrain, Royal Columbian Hospital, Save-On Foods, Shoppers, TD Bank & lots of restaurants. This is urban living at its best! OPEN HOUSE: Sun. Feb 9, 2-4pm.
Posted on
February 1, 2025
by
Steve Flynn
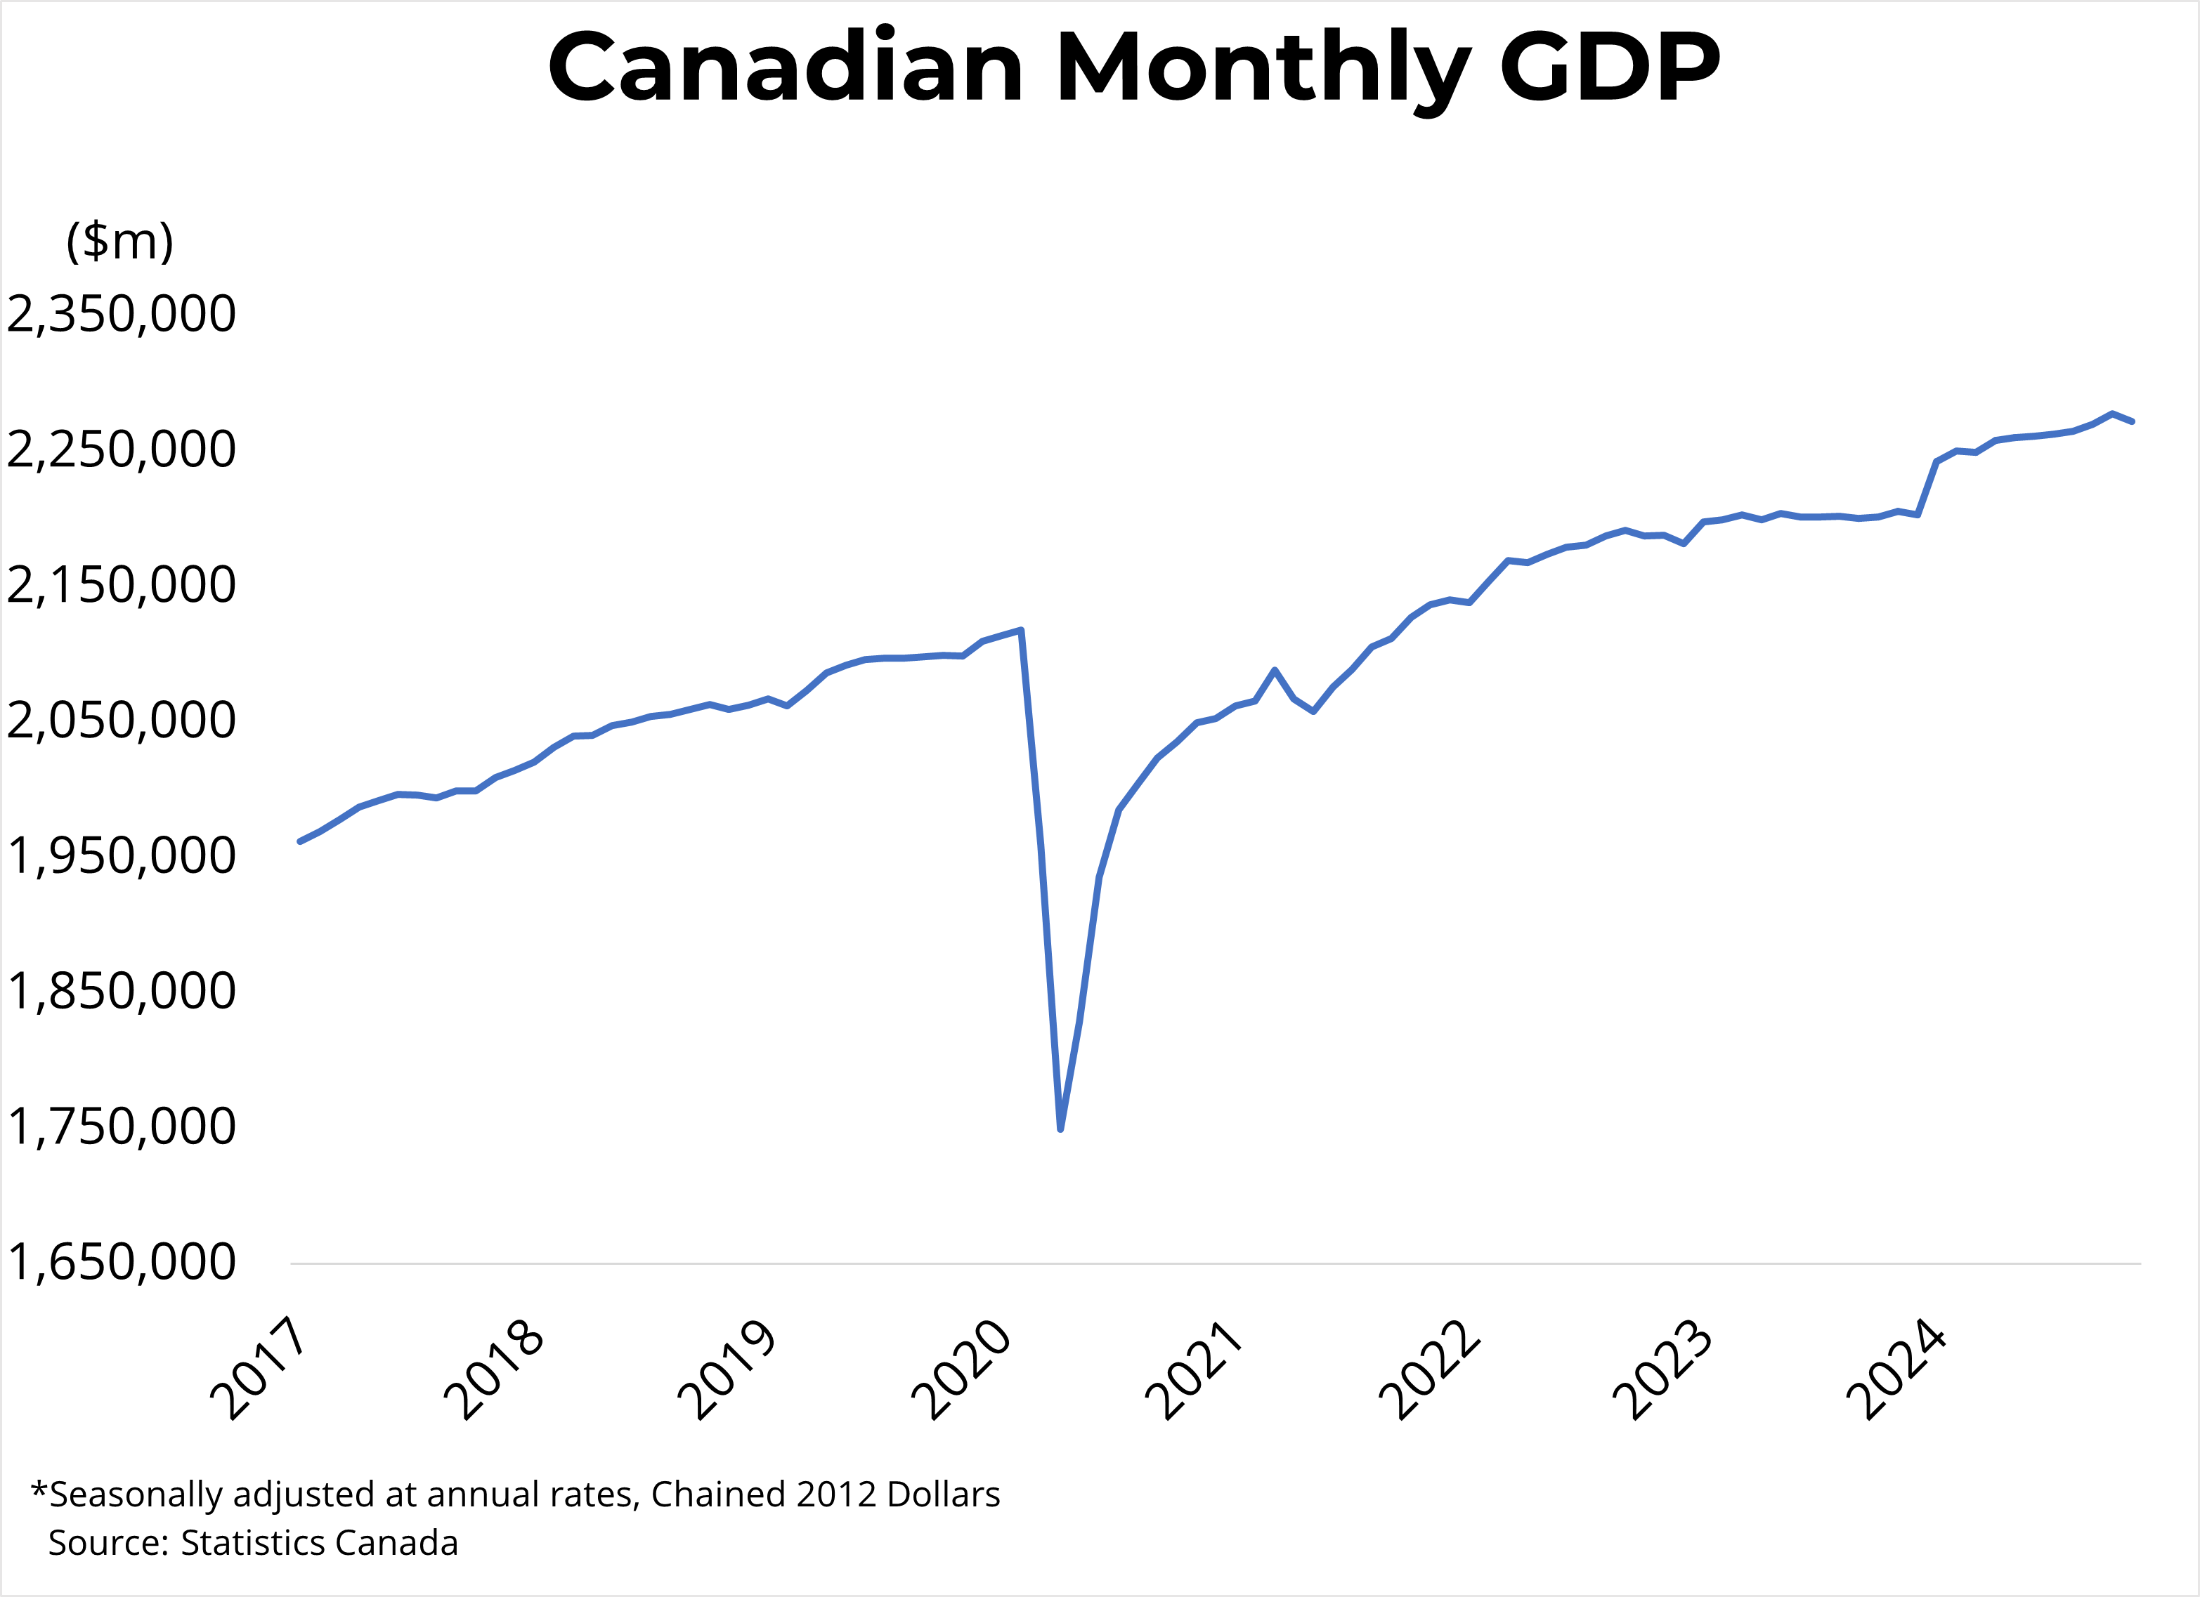
Canadian real GDP decreased by 0.2 per cent in November, following a 0.3 per cent increase in October. Service-producing industries fell by 0.1 per cent, while goods-producing industries contracted by 0.6 per cent. November's slower growth was broad-based, with 13 of 20 major industries seeing declines from the previous month. Downward pressure was led by the transportation and warehousing sector that was struck by widespread work stoppages. Conversely, growth was driven by gains in construction (+0.7 per cent), and the real-estate and rental and leasing sector (+0.3 per cent). Finally, GDP for real-estate offices and agents was up 3.4 per cent month-over-month. Preliminary estimates suggest that real GDP increased by 0.2 per cent in December.
After its first rate cut of 2025, the Bank of Canada will be displeased with Canadian economic growth continuing to fall short of its projection. Relatively weak retail activity and flat growth illustrates lingering weaknesses in the Canadian economy. Until further notice, we expect the Bank to cut by 25 basis points at its next meeting before reassessing. Of course, incoming Trump tariffs could change this landscape, as our economy would be sizeably damaged quite soon after imposition. Copyright British Columbia Real Estate Association. Reprinted with permission.
Posted on
January 30, 2025
by
Steve Flynn
Please visit our Open House at 204 258 NELSON'S CRT in New Westminster. Open House on Sunday, February 2, 2025 2:00PM - 4:00PM MODERN & sleek, 876 s.f, 2 bed/2 bath condo in New West's dynamic Brewery District neighbourhood. OPEN & bright concept w/stylish kitchen, dining & living room. Kitchen has LUXURY features: s/s appliances, quartz countertops & gas stove. Both bedrooms are decent-sized. 2 balconies, totaling approx 200 s.f. Excellent building amenities incl: party room, outdoor kitchen/bbq & dining area, dog park & dog wash, community garden plots + access to amazing Club Central w/gym, squash, sauna, steam, social kitchen + games room. 2 PETS & RENTALS allowed! 1 parking, 1 locker. Within 5 min walk: Sapperton Skytrain, Royal Columbian Hospital, Save-On Foods, Shoppers, TD Bank & lots of restaurants. This is urban living at its best! OPEN HOUSE: Sun, Feb 2, 2-4pm.
Posted on
January 26, 2025
by
Steve Flynn
Listed for $759,000 MODERN & sleek, 876 s.f, 2 bed/2 bath condo in New West's dynamic Brewery District neighbourhood. OPEN & bright concept w/stylish kitchen, dining & living room. Kitchen has LUXURY features: s/s appliances, quartz countertops & gas stove. Both bedrooms are decent-sized. 2 balconies, totaling approx 200 s.f. Excellent building amenities incl: party room, outdoor kitchen/bbq & dining area, dog park & dog wash, community garden plots + access to amazing Club Central w/gym, squash, sauna, steam, social kitchen + games room. 2 PETS & RENTALS allowed! 1 parking, 1 locker. Within 5 min walk: Sapperton Skytrain, Royal Columbian Hospital, Save-On Foods, Shoppers, TD Bank & lots of restaurants. This is urban living at its best!
Posted on
January 24, 2025
by
Steve Flynn
Canadian retail sales remained largely unchanged at $67.6 billion in November from the previous month. Compared to the same time last year, retail sales are up by 1.6 per cent. Furthermore, core retail sales, which exclude gasoline and automobile items, fell by 1.0 per cent month-over-month. In volume terms, adjusted for rising prices, retail sales were down 0.4 per cent in November.
Retail sales in British Columbia were up 0.4 per cent in November month-over-month and up 0.9 per cent compared to the same time last year. In the CMA of Vancouver, retail sales were up 0.4 per cent from the prior month and November 2023.
November's retail sales are highlighted by a notable drop in core sales following a modest recovery over previous months. The Bank of Canada remains braced for a 25-point cut next week and hopes to see its effects transmit into stronger Canadian retail spending in the first quarter of 2025. Copyright British Columbia Real Estate Association. Reprinted with permission.
Posted on
January 23, 2025
by
Steve Flynn
Please visit our Open House at 204 258 NELSON'S CRT in New Westminster. Open House on Sunday, January 26, 2025 2:00PM - 4:00PM MODERN & sleek, 876 s.f, 2 bed/2 bath condo in New West's dynamic Brewery District neighbourhood. OPEN & bright concept w/stylish kitchen, dining & living room. Kitchen has LUXURY features: s/s appliances, quartz countertops & gas stove. Both bedrooms are decent-sized. 2 balconies, totaling approx 200 s.f. Excellent building amenities incl: party room, outdoor kitchen/bbq & dining area, dog park & dog wash, community garden plots + access to amazing Club Central w/gym, squash, sauna, steam, social kitchen + games room. 2 PETS & RENTALS allowed! 1 parking, 1 locker. Within 5 min walk: Sapperton Skytrain, Royal Columbian Hospital, Save-On Foods, Shoppers, TD Bank & lots of restaurants. This is urban living at its best! OPEN HOUSE: Sun. Jan 26, 2-4pm.
Posted on
January 20, 2025
by
Steve Flynn
I have sold a property at 201 5598 Ormidale Street in Vancouver. See details here Don't miss this immaculate 2 bedroom + den townhouse with spacious ceilings, private street level entrance and an enormous patio! Enjoy the best of both worlds - centrally located and private. This unit is situated on the interior of the complex, away from the road. Across the street from Central Park, close to Metrotown & Crystal Mall, transit accessible. Complex has many amenities: work out at the fitness centre and then relax in a 60ft oasis pool with jacuzzi spa & roof top garden. The Wall Centre Central Park, designed to meet LEED Gold Standards by award winning architects features light wood-tone laminate floors, shaker-style cabinetry, quartz counters, and stainless steel appliances.
Posted on
January 19, 2025
by
Steve Flynn
Listed for $759,000 MODERN & sleek, 876 s.f, 2 bed/2 bath condo in New West's dynamic Brewery District neighbourhood. OPEN & bright concept w/stylish kitchen, dining & living room. Kitchen has LUXURY features: s/s appliances, quartz countertops & gas stove. Both bedrooms are decent-sized. 2 balconies, totaling approx 200 s.f. Excellent building amenities incl: party room, outdoor kitchen/bbq & dining area, dog park & dog wash, community garden plots + access to amazing Club Central w/gym, squash, sauna, steam, social kitchen + games room. 2 PETS & RENTALS allowed! 1 parking, 1 locker. Within 5 min walk: Sapperton Skytrain, Royal Columbian Hospital, Save-On Foods, Shoppers, TD Bank & lots of restaurants. This is urban living at its best!
Posted on
January 17, 2025
by
Steve Flynn
Canadian housing starts fell by 13 per cent to 231,468 units in December at a seasonally adjusted annual rate (SAAR). Starts were down 8 per cent from the same month last year. Single-detached housing starts were 9 per cent lower than last month at 57,626 units, while multi-family and other starts fell by 15 per cent to 173,842 (SAAR).
In British Columbia, starts fell by 8 per cent from last month to 47,137 units SAAR in all areas of the province. In areas of the province with 10,000 or more residents, single-detached starts dropped by 6 per cent to 4,303 units, while multi-family starts dropped by 9 per cent to 41,098 units month-over-month. Starts in the province were 25 per cent below the levels from December 2023. However, this drop-off is largely a base-month effect, as seasonally adjusted starts last December were among the highest levels seen in the past few years. Compared with last year, year-to-date starts were up by 28 per cent in Kelowna, 2 per cent in Abbotsford, and 1 per cent in Nanaimo, while being down by 15 per cent in Vancouver and 16 per cent in Victoria. Copyright British Columbia Real Estate Association. Reprinted with permission.
Posted on
January 15, 2025
by
Steve Flynn
Please visit our Open House at 204 258 NELSON'S CRT in New Westminster. Open House on Sunday, January 19, 2025 2:00PM - 4:00PM MODERN & sleek, 876 s.f, 2 bed/2 bath condo in New West's dynamic Brewery District neighbourhood. OPEN & bright concept w/stylish kitchen, dining & living room. Kitchen has LUXURY features: s/s appliances, quartz countertops & gas stove. Both bedrooms are decent-sized. 2 balconies, totaling approx 200 s.f. Excellent building amenities incl: party room, outdoor kitchen/bbq & dining area, dog park & dog wash, community garden plots + access to amazing Club Central w/gym, squash, sauna, steam, social kitchen + games room. 2 PETS & RENTALS allowed! 1 parking, 1 locker. Within 5 min walk: Sapperton Skytrain, Royal Columbian Hospital, Save-On Foods, Shoppers, TD Bank & lots of restaurants. This is urban living at its best! OPEN HOUSE: Sun. Jan 19, 2-4pm
Categories:
Abbotsford West, Abbotsford Real Estate
|
Bolivar Heights, North Surrey Real Estate
|
Brentwood Park, Burnaby North Real Estate
|
Brighouse, Richmond Real Estate
|
Burnaby
|
Burnaby Real Estate
|
Burnaby South Real Estate
|
Cape Horn, Coquitlam Real Estate
|
Cariboo, Burnaby North Real Estate
|
Central BN, Burnaby North Real Estate
|
Central Coquitlam, Coquitlam
|
Central Coquitlam, Coquitlam Real Estate
|
Champlain Heights, Vancouver East
|
Champlain Heights, Vancouver East Real Estate
|
Cloverdale BC, Cloverdale Real Estate
|
Cloverdale BC, Surrey Real Estate
|
Cloverdale Real Estate
|
Coal Harbour, Vancouver West Real Estate
|
Coaquitlam
|
College Park PM, Port Moody Real Estate
|
Collingwood VE, Vancouver East Real Estate
|
Coquitlam
|
Coquitlam West, Coquitlam Real Estate
|
Downtown NW, New Westminster Real Estate
|
Downtown VW, Vancouver West
|
Downtown VW, Vancouver West Real Estate
|
Eagleridge, Coquitlam Real Estate
|
False Creek North, Vancouver West
|
Fraserview NW, New Westminster
|
Fraserview NW, New Westminster Real Estate
|
Fraserview VE, Vancouver East Real Estate
|
GlenBrooke North, New Westminster Real Estate
|
Grandview Surrey, Surrey Real Estate
|
Harrison Hot Springs Real Estate
|
Hastings, Vancouver East Real Estate
|
Highgate, Burnaby South Real Estate
|
Hockaday, Coquitlam Real Estate
|
January 2014 Sales in Greater Vancouver
|
Metrotown, Burnaby South Real Estate
|
New Horizons, Coquitlam Real Estate
|
New Westminster Real Estate
|
Port Moody
|
Port Moody Real Estate
|
Quay, New Westminster Real Estate
|
Queensborough, New Westminster Real Estate
|
Richmond Real Estate
|
Riverdale RI, Richmond Real Estate
|
Riverwood, Port Coquitlam Real Estate
|
Sapperton, New Westminster Real Estate
|
Simon Fraser Univer., Burnaby North Real Estate
|
Surrey
|
The Heights NW, New Westminster
|
The Heights NW, New Westminster Real Estate
|
Tsawwassen Central, Tsawwassen Real Estate
|
Uptown NW, New Westminster Real Estate
|
Uptown, New Westminster Real Estate
|
Vancouver
|
Vancouver East Real Estate
|
Videocast of January 2014 sales
|
Walnut Grove, Langley Real Estate
|
West Central, Maple Ridge Real Estate
|
West End VW, Vancouver West Real Estate
|
Whalley, North Surrey Real Estate
|
Whalley, Surrey Real Estate
|
Willoughby Heights, Langley Real Estate
|
 Subscribe with RSS Reader